
Figure 2.
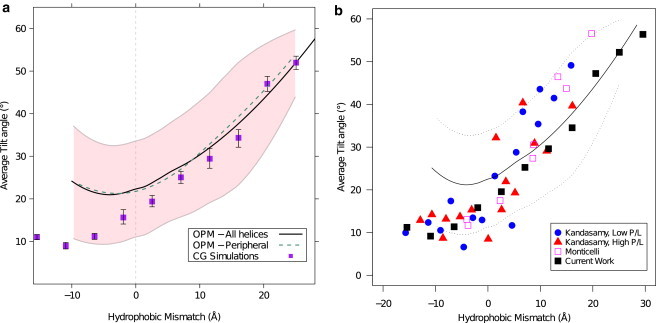
Average tilt angle as function of hydrophobic mismatch. (a) Compares tilt angle for all unique TM helices (black line) with peripheral unique TM helices (dashed green line, see text) as obtained from the experimental data in the OPM database with CG simulation of hydrophobic helices in a lipid bilayer (purple squares). The experimental data in the OPM database give a distribution of tilt angles represented by (solid line) for the average, and (pink shading) for 1 SD (fit and SD were obtained by the LOESS method (49)). The simulated CG results are an average from system of both five-bead and six-bead tail lipids, representing two membranes with different hydrophobic thicknesses, with error-bars representing the error in average values of both systems. (b) Further compares our simulation (black squares) and OPM experimental data (black line, standard deviation represented by dashed lines) with previously published simulation results for KALP peptides. Results by Kandasamy and Larson (30) are shown for low (blue circles) and high (red triangles) protein to lipid ratio. (Magenta squares) Results of coarse-grained simulations by Monticelli et al. (45).