
Figure 3.
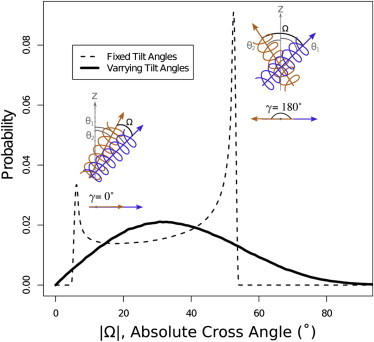
Reference cross-angle (Ω) distribution. (Dashed line) Reference cross-angle distribution of two helices with fixed tilt angles, and , and random projection angle, γ; (solid line) reference cross-angle distribution of two helices with normally distributed tilt angles with mean , and standard deviation σ1, σ2, respectively. These mean and standard deviation values correspond to the experimental tilt angles at hydrophobic mismatch ranges Δd1 = 30 Å and Δd2 = 10.0 Å, respectively, as extracted from Fig. 2a. These amount to = 23.6°, = 29.4°, σ1 = 11.3°, and σ2 = 12. 4°. A schematic sketch of helices is provided for both extremes of γ = 0° and γ = 180°.