
Figure 5.
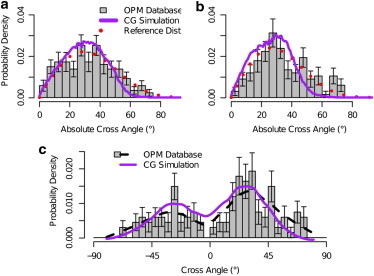
Comparison of cross-angle distributions. (Gray boxes) Experimental cross-angle distribution; (purple curves) simulated cross-angle distribution; and (red dotted lines) reference cross-angle distribution. The reference distribution is based on the tilt angle distribution of the helices’ mismatch as extracted from Fig. 2. (a) Absolute cross angle of pairs of neighboring helices with hydrophobic mismatches in the ranges Δd1 ∈ (2,5] Å and Δd2 ∈ (4,7] Å compared to simulated helices of mismatch Δd = 3.2 Å, 7.7 Å, respectively. (b) Experimental neighboring pairs in ranges Δd1 ∈ (0,3] Å and Δd2 ∈ (0,3] Å compared to simulated helices of mismatch Δd = 3.2 Å, 3.2 Å, respectively. (c) Full cross-angle distribution (and not the absolute one) for the same set used in plot b. Error bars in all three plots represent 0.9 confidence intervals.