
Figure 7.
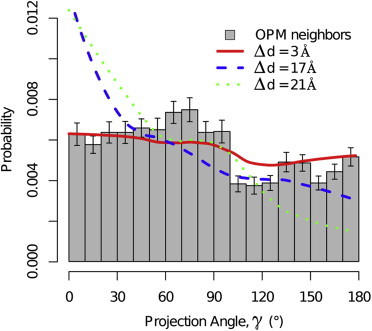
Histogram of experimental projection angles of neighboring helices (gray boxes) shows tendency toward lower (γ < 100°) angles with p-value <0.0001 (based on a binomial test). (Lines) Representative projection angle histograms from CG simulations; each line corresponds to a different pair of same-mismatch helices: Δd = 3 Å (red solid), 17 Å (blue dashed), and 21 Å (green dotted). These show that the trend of overpopulation of lower projection angles is observed in simulations as well and varies in strength and shape with mismatch. Error bars represent 0.9 confidence intervals in experimental projection-angle histogram.