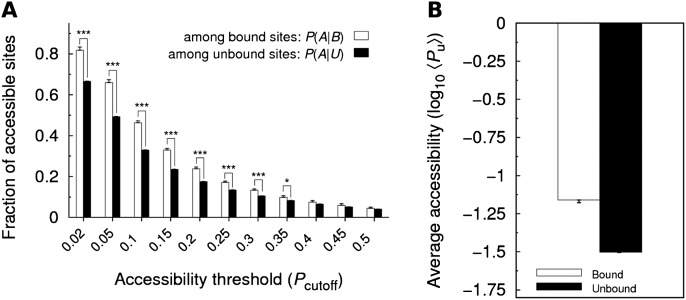
FIGURE 2.
Comparison between the accessibilities of bound and unbound sites. (A) Fractions P(A|B) and P(A|U) of accessible sites among bound and unbound sites, respectively, are compared for 11 values of the accessibility threshold Pcutoff, assuming a nucleation region of length n = 7. Statistical significance was evaluated with the paired one-sided t-test [(*) P ≤ 0.05; (**) P ≤ 0.01; (***) P ≤ 0.001; P-values >0.05 are not indicated]. (B) Average accessibility of a 7-mer seed match is shown for bound and unbound sites. Statistical significance was evaluated with the one-sided Wilcoxon rank sum test. (P = 8.63 × 10−41). As in all further figures, error bars represent standard errors.

