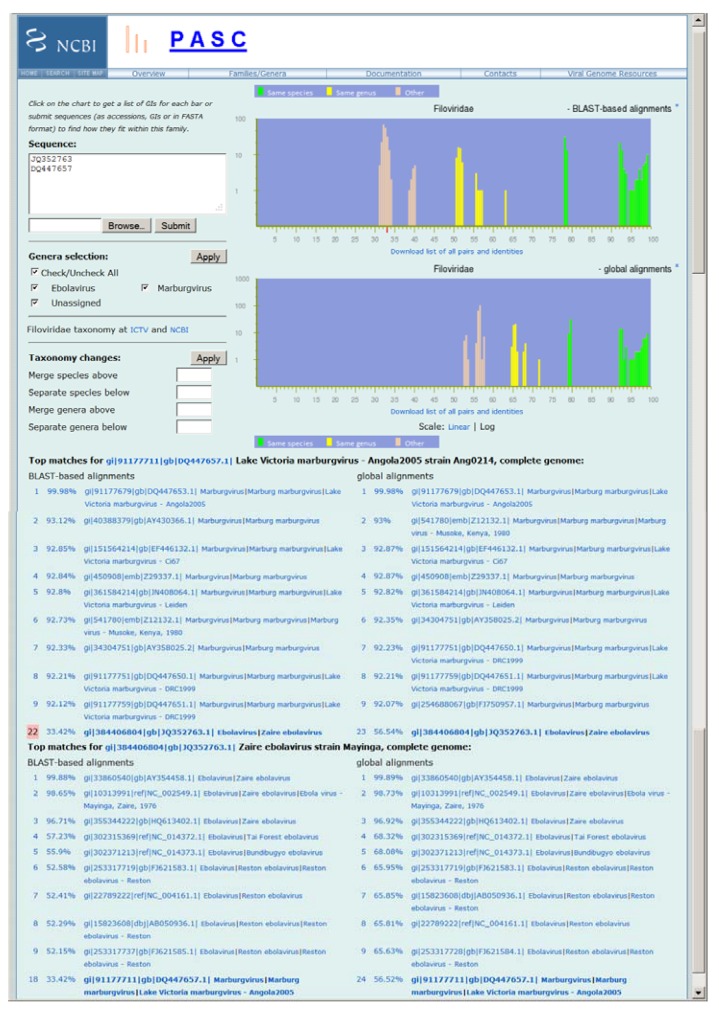
Figure 1.
Frequency distribution of pairwise identities for the complete genome sequences of filoviruses, and the application in classifying newly sequenced viruses. The two plots represent results obtained by the BLAST-based alignments and global alignments respectively. The green, yellow and peach bars in the plots represent pairs of genomes that are assigned to the same species, different species but in the same genus, and different genera respectively in the current National Center for Biotechnology Information (NCBI) Taxonomy Database. The top matches for each input genome (JQ352763 and DQ447657) to the existing genomes in GenBank and other input genome are listed, and their pairwise identities are shown. The small red bar on the X-axis of the top plot indicates the percentage of identity of the selected pair (#22 which is highlighted). Not all virus species names listed reflect the most recent International Committee on Taxonomy of Viruses (ICTV) species names.

