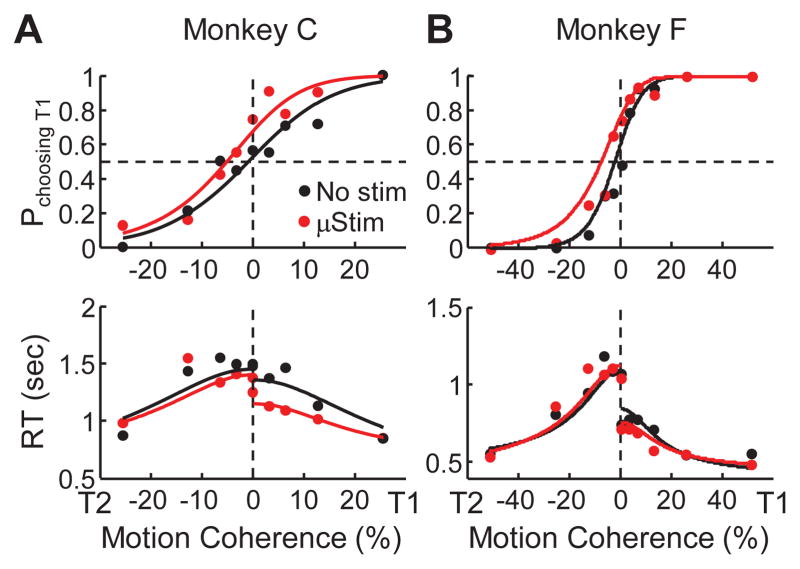
Figure 2. Example performance.
Example psychometric (top) and chronometric (bottom) functions from a single session for monkey C (A) and monkey F (B). Psychometric functions are plotted as the fraction of trials in which the monkey chose the T1 target as a function of signed coherence, where positive/negative coherence indicates motion towards T1/T2. Chronometric functions are plotted as the mean RT, measured as the time between motion stimulus onset and saccade onset, on correct trials as a function of signed coherence. Solid curves are simultaneous fits of both functions to a drift-diffusion model (DDM) with asymmetric bounds, separately for trials with (red) and without (black) electrical stimulation.

