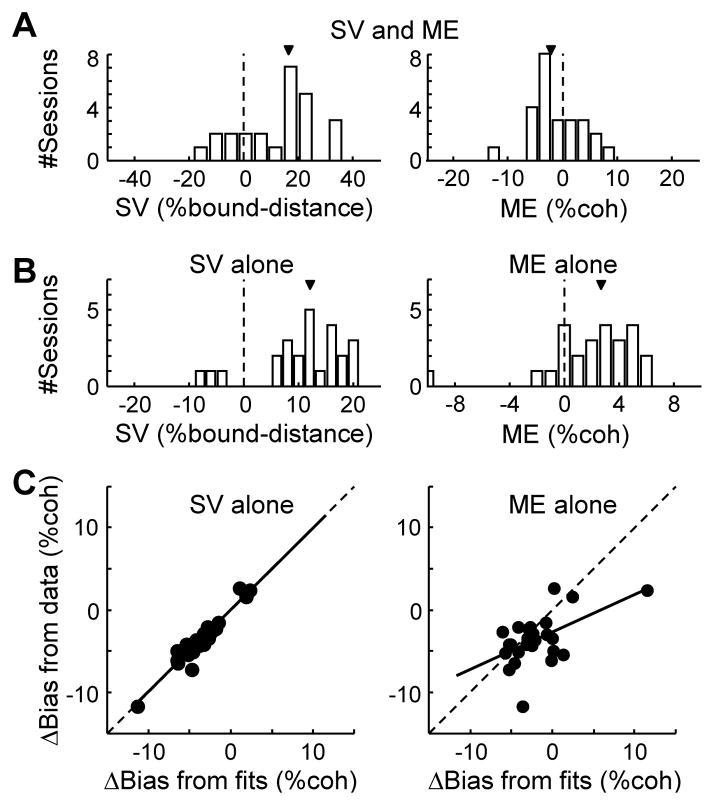
Figure 5. Microstimulation-induced Δbias is captured by a non-zero starting value in the DDM.
A. Histograms of best-fitting parameters SV (starting value, left) and ME (momentary evidence, right) in a DDM model with both terms (model 2; see also Table S2 and Experimental Procedures). Arrows indicate median values. SV is expressed as the percentage of bound distance (A+B in DDM). B. Histograms of best-fitting parameters SV (left) and ME (right) in the reduced models with each term alone (models 3 and 4, respectively). C. Scatterplots of Δbias measured from experimental data (ordinate), using independent DDM fits for trials with and without microstimulation, and Δbias predicted (abscissa) using the SV-alone model (left, model 3) or the ME-alone model (right, model 4). Solid lines are linear fits (slope: 0.99 and 0.45, F-value: 251.8 and 9.9, p: <0.0001 and 0.0045, respectively). For these analyses, sites with significant Δbias were included (n=25).

