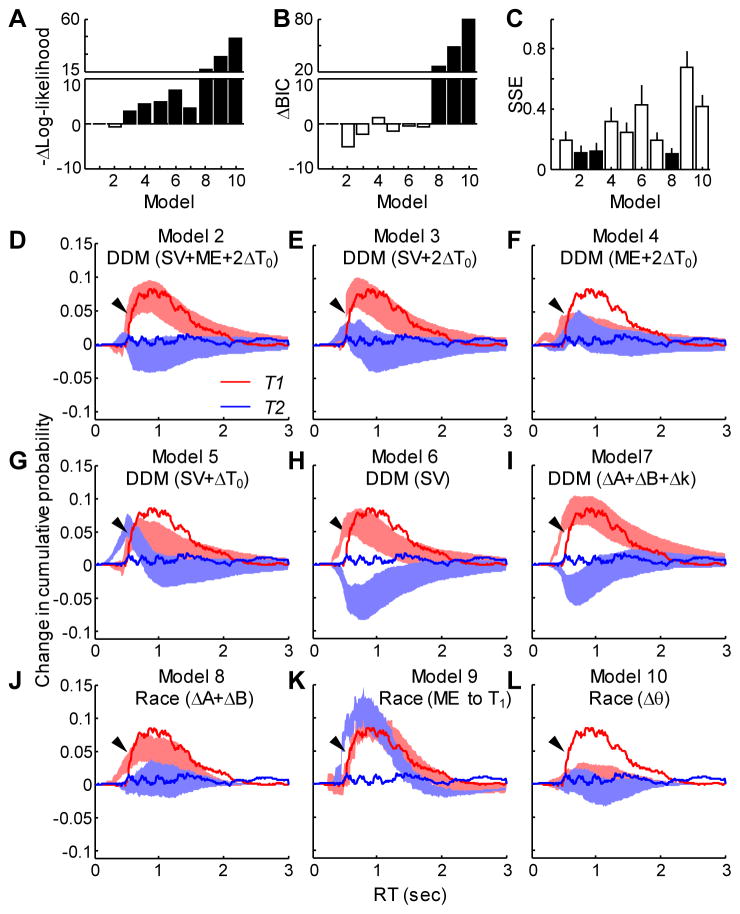
Figure 6. Comparison of models for capturing both choice and RT effects.
A. Difference in mean negative log likelihood between the given model and model 1 (two independent DDMs fit to trials with and without microstimulation). Note that the first bar is at zero by definition. The value for model 2 is close to zero. Smaller values indicate better fits. See Table S2 and panels D–L for model identities. Filled bars indicate a significant non-zero difference in means (t-test, p<0.05, with corrections for multiple comparisons). B. Difference in Bayesian Information Criterion from model 1. Same conventions as A. Smaller values indicate better fits. C. Sum of squared error (SSE, mean±SD) between the observed and simulated microstimulation-induced change in cumulative RT distributions. Filled bars indicate significantly smaller SSE in models 2, 3, and 8 than the others (p<0.05, with corrections for multiple comparison). D–L. Difference in the cumulative distribution of RT between trials with and without microstimulation (see Fig. S4) for models 2–10, as indicated. Experimental data are shown as solid curves. Simulation results are shown as shaded areas (mean ± SD). Red: T1 choice; blue: T2 choice. Arrows point to the rising portion of the T1 curve for the experimental data.

