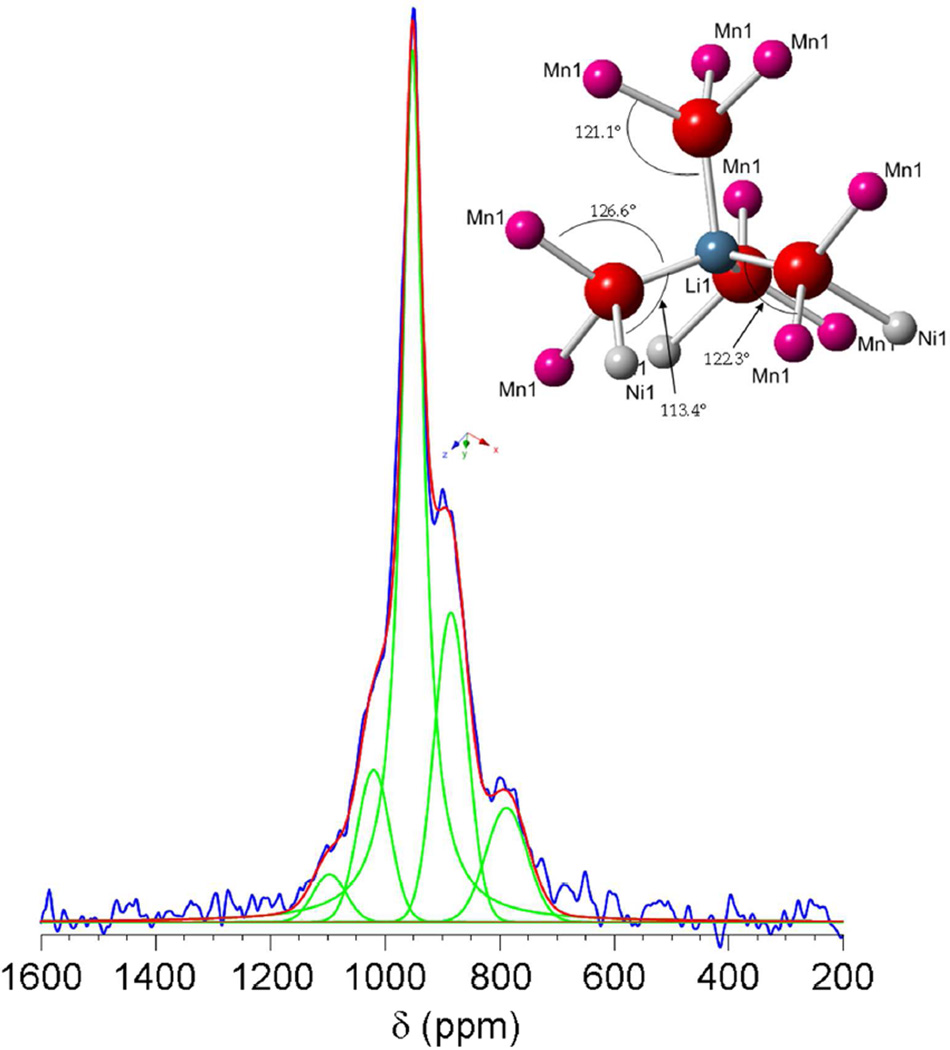
Figure 6.
Deconvolution of the 6Li MAS NMR spectrum of OH700C. See text for details on experimental constraints. The best fit was achieved by using a Lorentzian function for the most intense peak and the largest line broadening for the peak at 788 ppm. Blue: experimental data; red: additive theoretical spectrum; green: deconvoluted peaks. The inset represents the lithium local environment in an ideally ordered spinel structure with formula LiNi0.5Mn1.5O4. Relevant bond angles are provided.

