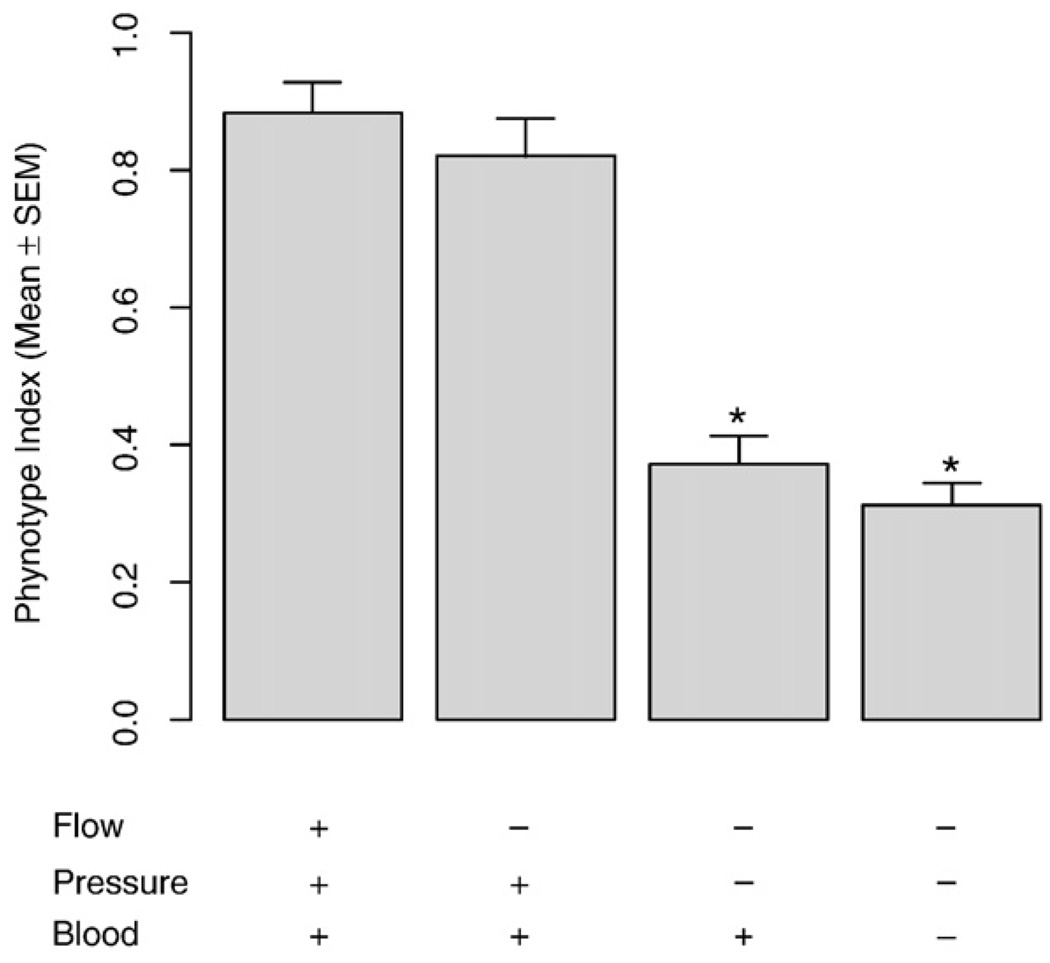
Fig. 11.
The phenotype index of vascular smooth muscle cells (VSMC) in four surgical treatment groups in vivo. Of the paired common carotid arteries in each rat, one side is treated to eliminate either flow, pressure, or blood or a combination of these. The other side is subjected to sham surgical manipulation. After 12 h, rats were sacrificed and common carotid arteries were used for Quantitative RT-PCR to quantify the expression level of VSMC-specific marker genes. The ratio of each VSMC-specific marker gene expression level (treatment side/sham side) was calculated for each rat. The average ratio was then calculated for each treatment group and termed the “phenotype index”. The values represent the mean±SEM for 4–10 rats. *Denotes significant differences relative to the control group with the presence flow, pressure, and blood.

