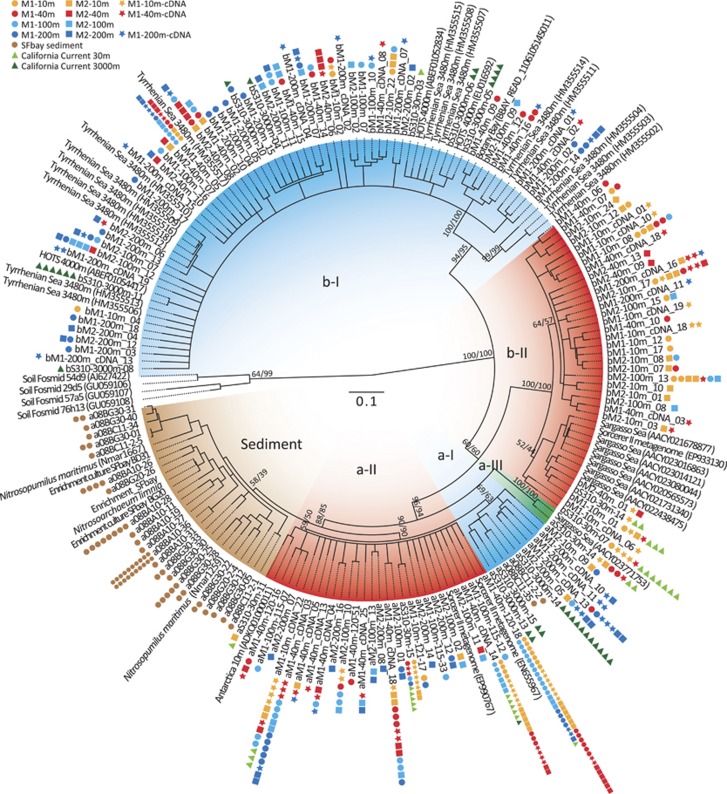
Figure 1.
Phylogeny of marine thaumarchaeal nirK sequences. Maximum likelihood (ML; PhyML, general time-reversible (GTR)+Γ) 30% cutoff consensus tree with 1000 bootstrap replicates, based on 453 bp. Major groupings were all supported by neighbor-joining (NJ, Jukes-Cantor distance correction, 1000 bootstraps). Numbers on branches are bootstrap values from ML/NJ. Only sequence representatives from a 97% similarity OTU cutoff are shown in tree. Colored symbols show total number of clones represented by a sequence (see legend). Sequence name prefix ‘a/b' refers to which primer pair the sequence was amplified with (AnirKa or AnirKb).

