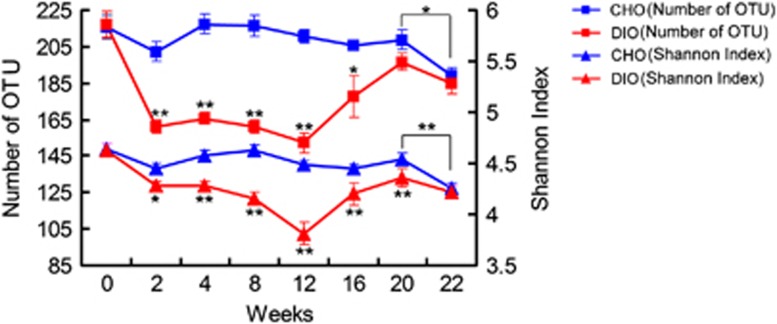
Figure 2.
Changes in the richness and diversity of the gut microbiota during dietary alternations. OTU and Shannon diversity index numbers are shown for each group at eight time points (OTU cutoff, 96%). Calculations were performed after rarefying to an equal number of reads (1000) for all samples to control for unequal sampling effort. Data are shown as means±s.e.m., *P<0.05, **P<0.01 by one-way ANOVA.

