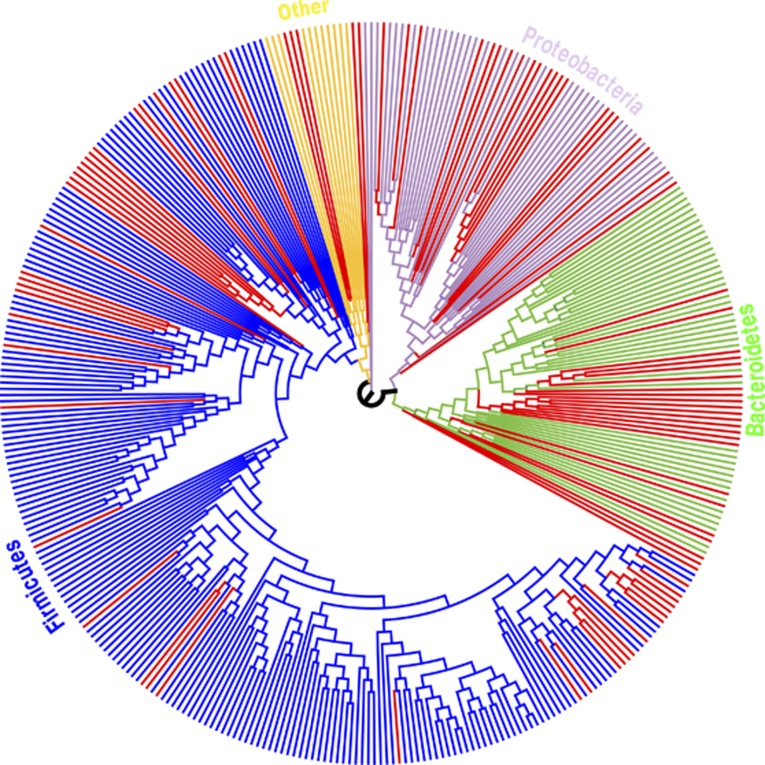
Figure 3.
Maximum likelihood tree generated from the 371 OTUs in which the OTU was observed in at least 25% of our patients. The tree was generated using the RaxXML EPA server http://i12k-exelixis3.informatik.tu-muenchen.de/raxml (see Materials and methods). Branches are colored based on RDP Phylum level assignments. Red-colored branches represent OTUs significantly different between cases and controls within each Phylum (at 10% FDR).

