Table 1.
Activity profiles of inhibitors 4–11a
| Compd | ||||||
|---|---|---|---|---|---|---|
| Structure | Compound code names | IC50 (μM) PfDHODH | EC50 (μM) Pf3D7 | IC50 (μM) hDHODH | IC50 (μM) PbDHODH | |
| 1* |
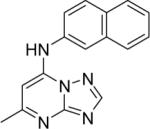
|
DSM1 | 0.047 | 0.076 | > 100 | 0.23 |
| 2* |
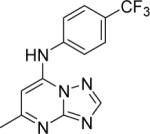
|
DSM74 | 0.28 | 0.34 | > 100 | 0.38 |
| 4 |
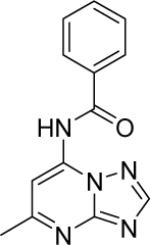
|
DSM154 | > 100 | >100 | > 100 | > 100 |
| 5 |
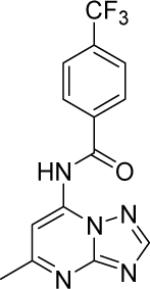
|
DSM155 | > 100 | > 50 | > 100 | > 100 |
| 6 |
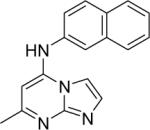
|
DSM71 | 0.15±0.01 | 0.19 (0.15 – 0.25) | > 100 | 2.8±0.28 |
| 7 |
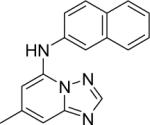
|
DSM96 | 4.8±0.7 | 5.2 (3.6 – 6.7) | n.d. | 6.3±0.80 |
| 8 |
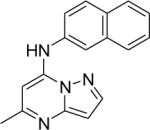
|
DSM68 | 0.4±0.09 | 0.91 (0.80 – 1.0) | > 100 | 3.3±0.4 |
| 9 |
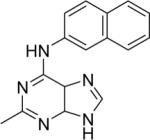
|
DSM23 | 0.44±0.17 | 2.2 (1.2 – 3.7) | > 100 | 11±3.3 |
| 10 |
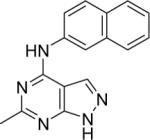
|
DSM70 | > 100 | > 12.5 | n.d. | n.d. |
| 11 |
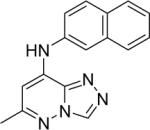
|
DSM105 | > 50 | > 5 | n.d. | >50 |
| 12 |
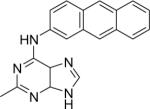
|
DSM25 | 4.8±0.38 | 3.2 (2.4 – 3.5) | n.d. | > 10 |
| 13 |
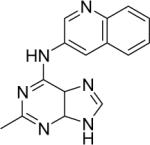
|
DSM78 | 27±6.3 | > 10 | n.d. | n.d. |
| 14 |
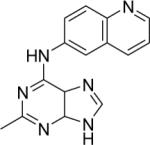
|
DSM79 | >25 | 3.2 (2.4 – 4.3) | n.d. | n.d. |
| 15 |
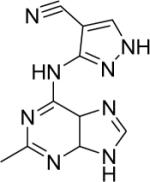
|
DSM80 | > 100 | > 25 | n.d. | n.d. |
| 16 |
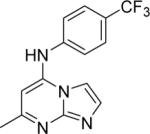
|
DSM151 | 0.077 ± 0.008 | 0.32 (0.30 – 0.35) | > 100 | 0.17 ± 0.018 |
