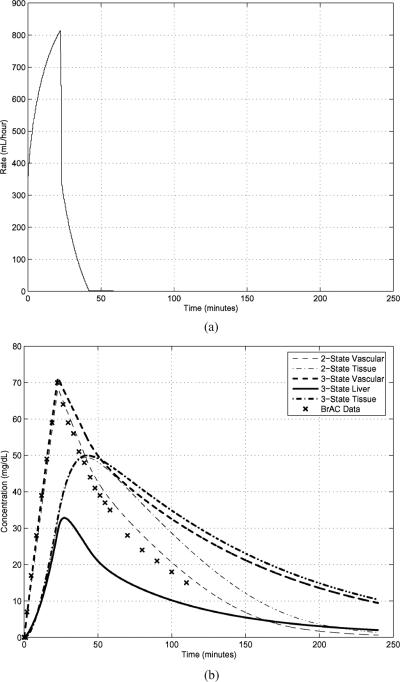
Fig. 2.
Intravenous input of a 6% ethanol solution [Panel (a)] and experimental BrAC measurements and PBPK2 and PBPK3 state-variable trajectories after conversion to concentrations [Panel (b)] for the “slopes” IV input. The parameters for the models come from previous measurements on the same human subject for which the BrAC data were recorded.

