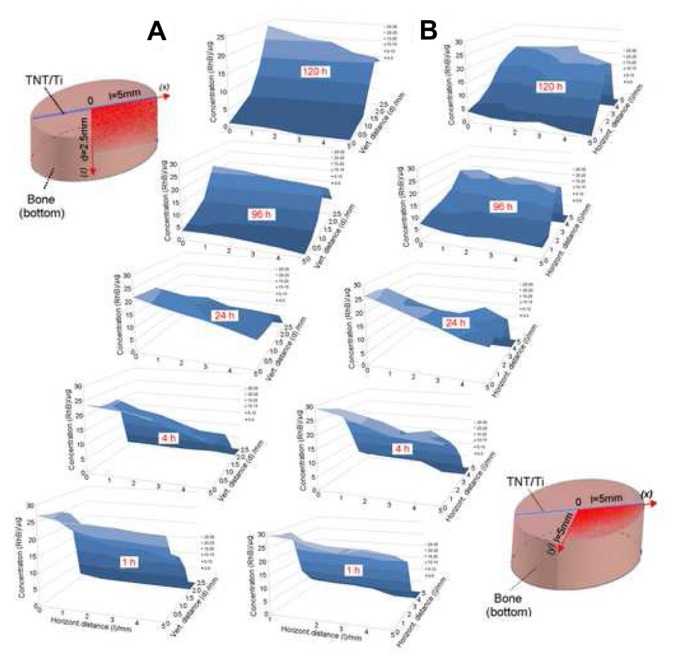
Figure 7.
Two-dimensional concentration graphs of the model drug (rhodamine B [RhB]) released from implants based on titania nanotube (TNT) arrays on the surface of titanium (Ti) wires. The graphs show spatial distribution in the trabecular bone samples: drug distribution is presented at (A) the vertical (vert) plane (x-z) of the bottom part of the bone and (B) the horizontal (horizont) plane (x-y) from the implant surface at different release times (1, 4, 24, 96, and 120 hours [h]).
Note: The concentration changes are presented only for a selected area of bone (one quadrant), as illustrated in the bone diagrams (left and right).

