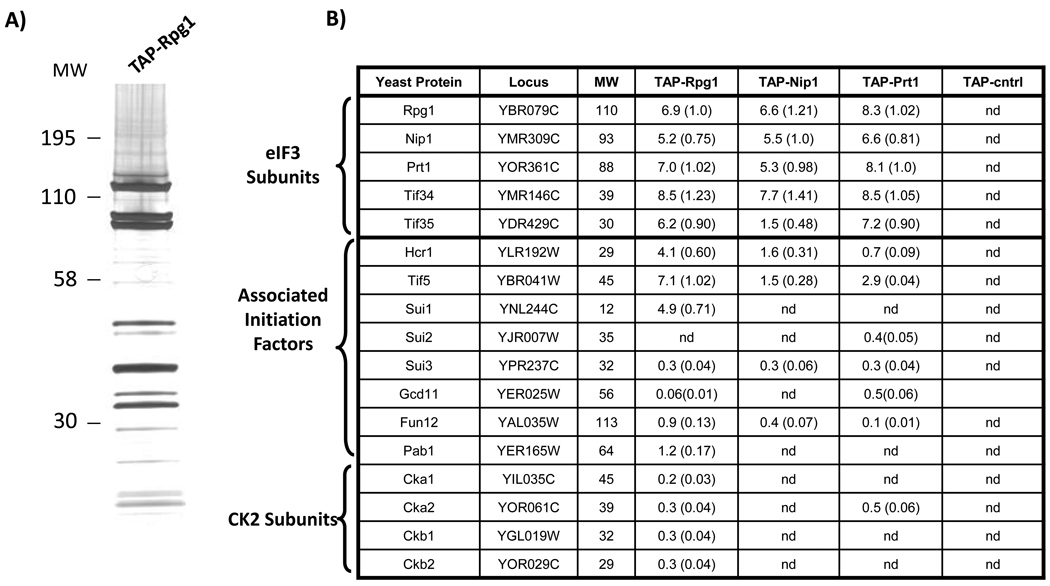
Figure 1. Purification and mass spectrometry identification of eIF3 components.
The eIF3 complex was isolated from S. cerevisiae by tandem affinity purification (TAP). Complexes and control extracts were prepared in duplicate or triplicate from strains expressing affinity tags specific for three core eIF3 components (Rpg1, Nip1, and Prt1) and the translation initiation factor Tif5, as well as an isogenic, untagged yeast strain. (A) Silver-stained SDS-PAGE separation of a TAP-Rpg1 purification. (B) MudPIT mass spectrometry analysis of the purifications from the four different TAP-tagged strains and the control strain (TAP-cntrl). The results from one of the replicate experiments are shown. The predicted molecular weights (MW) of the detected yeast proteins (rows) are shown in kDa. For each tagged strain and the control, protein abundance factors (PAFs) were calculated for the identified proteins (PAF = (the number of non-redundant spectra identifying the protein) / (MW of the protein) ×10439. The relative stoichiometry of each protein (in parentheses) was determined by normalizing its PAF to the PAF of the TAP-tagged protein targeted in the purification. (nd: not detected).

