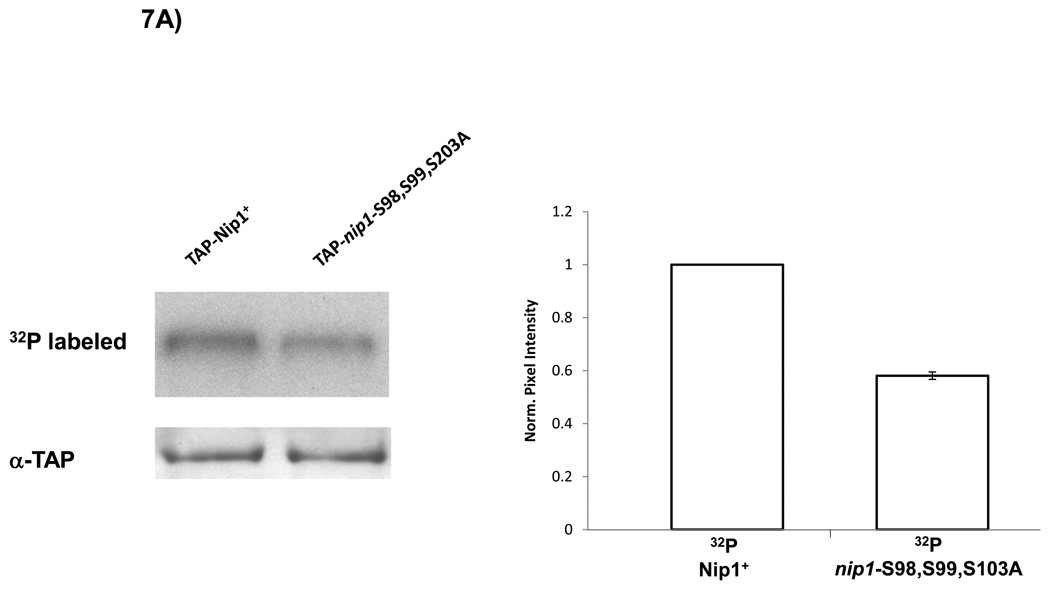
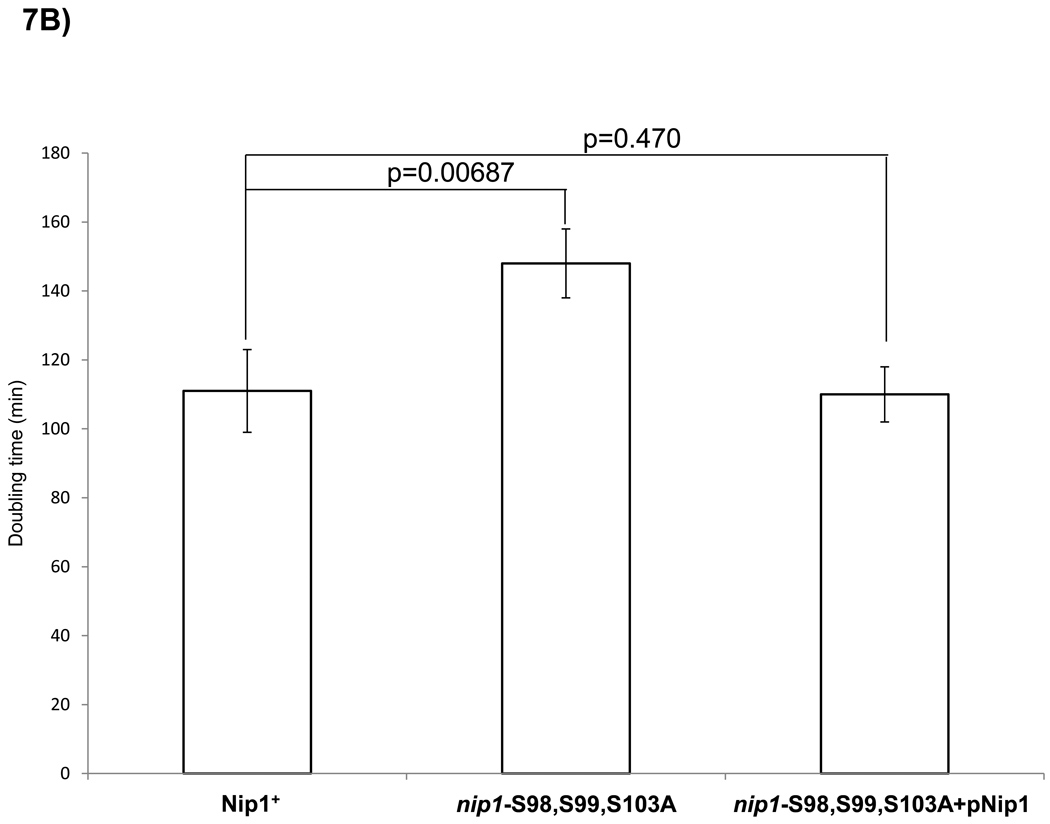
Figure 7. Mutation of S98, S99 and S103 in Nip1 reduces in vivo phosphorylation and growth rate.
nip1 null mutants containing plasmids expressing either wild-type Nip1 or a Nip1 mutant protein in which S98, S99 and S103 were replaced by alanines were examined. (A) SDS-PAGE separation of TAP-Nip1 following in vivo 32P metabolic labeling. The S98,S99, S103A mutation results in a 41% reduction of the mutant signal relative to wild-type based on densitometry using values normalized for the α-TAP loading control. As a control, western blotting with an α-TAP antibody shows equivalent amounts of TAP-Nip1 in each lane. (B) Doubling time for each strain (wild-type and mutant) was determined from the logarithmic growth phase of the cells in triplicate. Comparison of doubling times reveals that the strains harboring the mutation have a doubling time increased by 33%. A one-tailed t-test reveals a p-value between the wild-type and mutant doubling times of 0.00687. This defect is rescued with a wild-type copy of Nip1 in the mutant strain.


