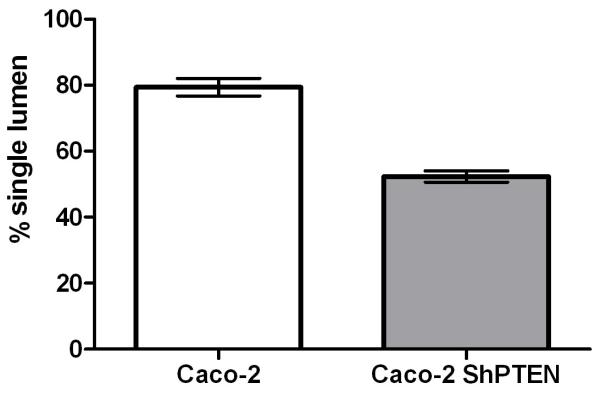
Fig 3b. Lumen formation in Caco-2 and Caco-2 ShPTEN glands.
Single lumens developed in 79.3 ± 2.7 % Caco-2 vs 52.3 ± 1.7% Caco-2 ShPTEN glands (p<0.001;ANOVA; n=3). Assays conducted in triplicate with 127 ± 24 Caco-2 and 147 ± 33 glands per experiment. Data for PTEN-deficient cells are denoted in the grey bar.

