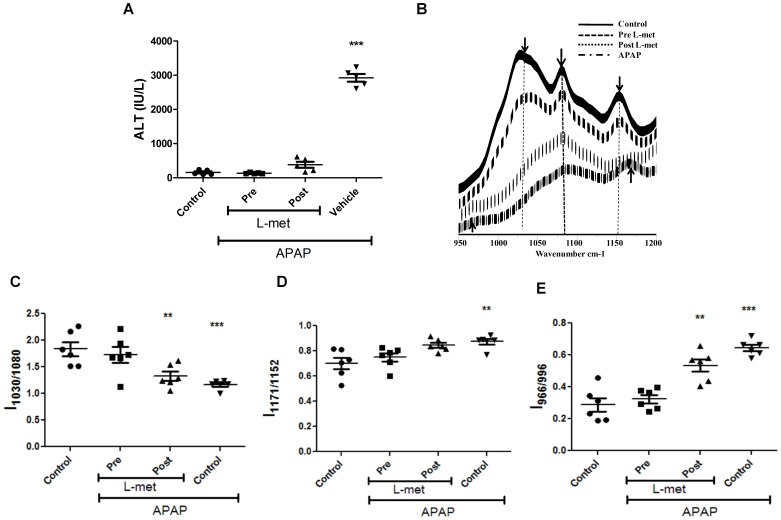
Figure 5. Studies with pre and post L-methionine treatment in APAP treated BALB/c mice.
Changes in ALT amounts in sera upon pre and post L-methionine treatment in APAP treated mice (A). FTIR spectra (950 cm− 1 to 1200 cm− 1) of pre- and post- L-methionine treatment in APAP treated mice livers (B). Changes in glycogen (C), cholesteryl ester (D) and DNA (E) amounts upon pre and post L-methionine treatment of APAP treated mice livers. All data are represented as mean ± S.E. with n = 5 or more mice.

