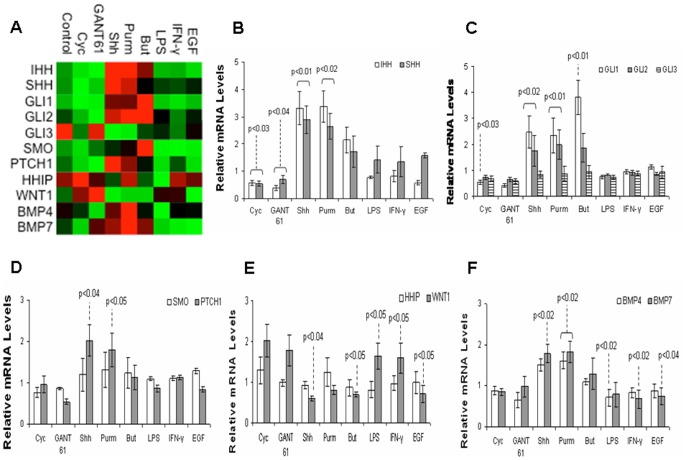
Figure 1. Gene modulation in HT-29 cells upon exposure to different stimuli.
Heat map representation of gene expression determined by RT-qPCR. HT-29 cells were treated with Shh (Sonic Hedgehog), Purm (purmorphamine), But (butyrate), LPS, IFN-γ, EGF, with or without the addition of cyclopamine (Cyc), GANT 61, or DMSO (vehicle) for 24 hours (A). Histograms of individual gene expression fold changes in HT-29 cells: IHH and SHH (B); GLI1, GLI2 and GLI3 (C); SMO and PTCH1 (D); HHIP and WNT1 (E); and BMP4 and BMP7 (F). The graphs use the same samples as in (A). Values represent the means ± SEM of three independent experiments and are normalized to GAPDH, beta-actin, and RPL32 RNA genes. Significant changes in relation to the control group are highlighted.

