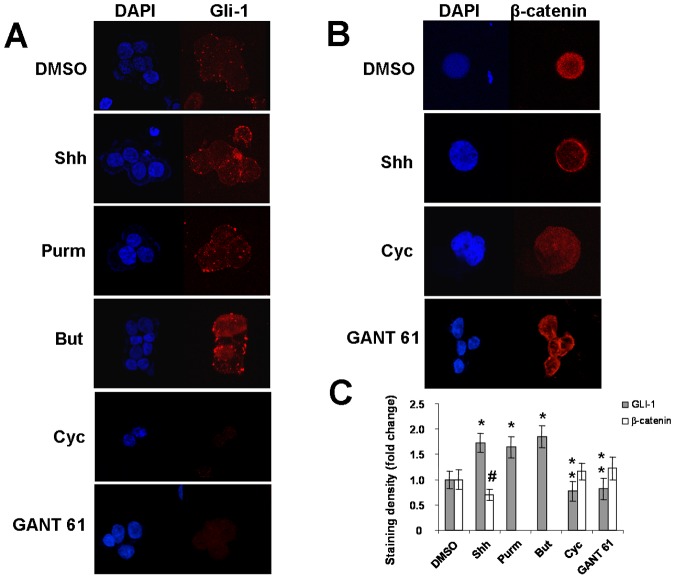
Figure 2. Distribution and levels of Gli-1 and β-catenin in HT-29 cells.
Confocal microscopy of cytospin preparations showing the relative nuclear and cytoplasmic distribution and levels of Gli-1 (A) and β-catenin (B) in HT-29 cells exposed to different stimuli for 24 hours. Analysis of protein staining densities confirm that Gli-1 significantly increases after treatment with Shh (Sonic Hedgehog), Purm (purmorphamine), or But (butyrate), compared to cells treated with DMSO (vehicle) (*P<0.04), and compared to cells treated with Cyc (cyclopamine) or GANT 61 (**P<0.02). Density of β-catenin significantly decreases upon treatment with Shh (# P<0.04) compared to DMSO, Cyc, or GANT 61 (C). Nuclei are stained with DAPI (blue). Micrograph panel is representative of 3–4 experiments for each condition (Original magnification ×1000).

