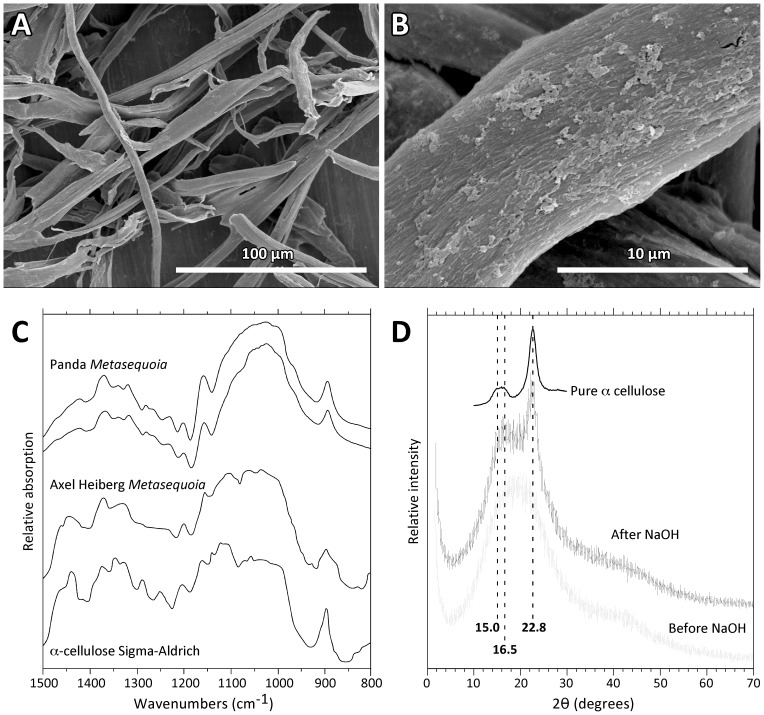
Figure 2. Cellulose extracted from Panda Metasequoia.
A. SEM of cellulose fibers at low magnification. B. SEM at higher magnification showing surface texture. C. Duplicate FTIR spectra (800–1500 cm−1) of the same material, shown in relation to Middle Eocene cellulose from Axel Heiberg Island Metasequoia [15] and laboratory standard (Sigma-Aldrich) α-cellulose. D. X-ray diffraction traces of Panda cellulose extracts before (grey) and after (black) treatment with NaOH. Peaks associated with α-cellulose crystallinity are indicated by vertical dashed lines, whereas the idealized spectrum of pure α-cellulose is shown above the Panda traces [17].

