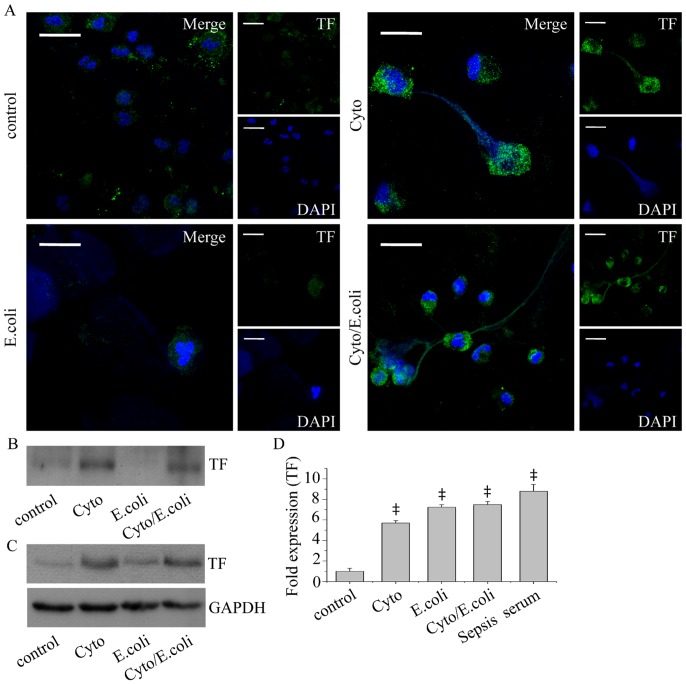
Figure 3. TF localization in NETs after in vitro stimulations.
(A) Detection of TF in NETs released by control neutrophils treated with TNF-α, IL-1β and G-CSF (Cyto), or E. coli alone (E. coli) or E. coli in the presence of the aforementioned cytokines (Cyto/E. coli), as assessed by confocal microscopy (z stack analysis, 0.3 µm per plane). One representative out of four independent experiments is shown (DNA labeled with DAPI; blue, anti-TF monoclonal antibody; green) (original magnification 600×). Scale bar represents 10 µΜ. (B) TF levels in NET-isolated proteins and (C) cell lysates, assessed by immunoblotting. One representative out of four independent experiments is shown. (D) TF mRNA levels in untreated control neutrophils (control) or treated with TNF-α, IL-1β and G-CSF (Cyto) or E. coli alone (E. coli) or in the presence of the aforementioned cytokines (Cyto/E. coli) or serum from patients with sepsis (Sepsis serum). Data are representative of four independent experiments and presented as mean ± SD. (‡P<.05).

