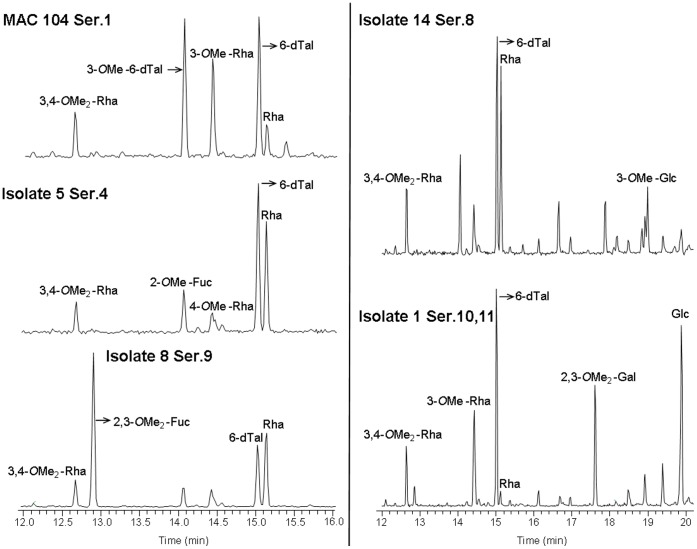
Figure 3. GC profiles of purified GPLs from M. avium spp. 1, 5, 8, 14 and 104.
GPLs were hydrolyzed using 2 M trifluoroacetic acid, reduced and acetylated. Aditol acetate GC profiles were obtained and peaks were identified by MS analyses. Shown are representative plots for each serovar (N = 3). Note that the horizontal axis for isolates 104, 5 and 8 (left side of figure) differs from isolates 14 and 1. Methyl (Me); Rhamnose (Rha); Talose (Tal); Fucose (Fuc); Galactose (Gal); Glucose (Glc).

