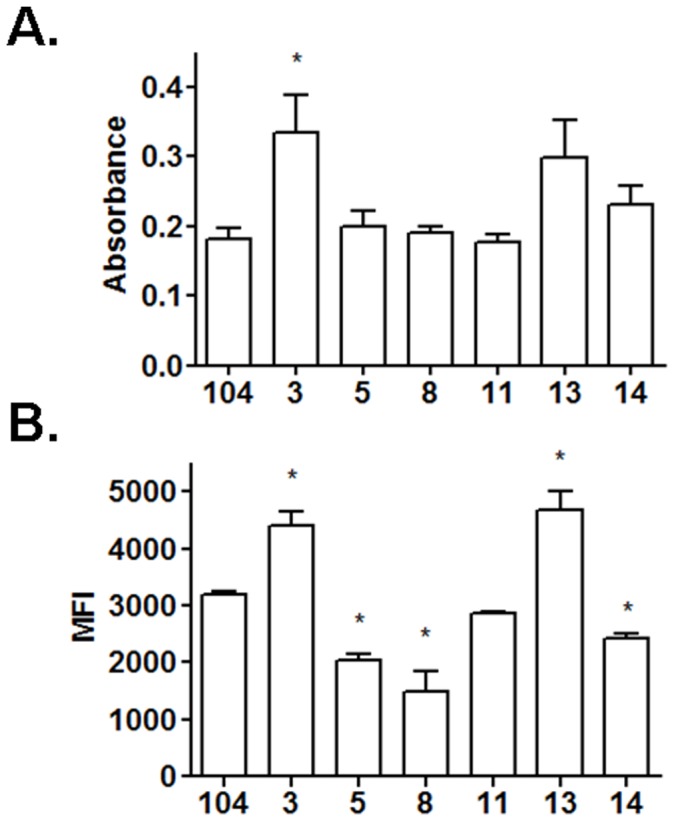
Figure 5. Detection of ManLAM on the bacterial surface. A.

M. avium spp. isolates (2×10⁶/well) in a 96 well plate (triplicate wells per test group) were blocked with BSA and incubated for 2 h with CS-35 mAb followed by a secondary HRP-Ab. The graph shows cumulative data of N = 3 for selected samples (mean±SEM; *P<0.05). See table 4 for the complete set. B. Live bacilli single cell suspensions (1×10⁶) were blocked with 2% BSA in PBS, washed with PBS followed by staining with anti-LAM CS-35 in 2% BSA in PBS for 20 min at 4C. After further washing, samples were analyzed by flow cytometry. Mean fluorescence intensity (MFI) was measured for each isolate and the average values of 2 samples were obtained. Shown is cumulative data of N = 2 (mean±SEM). *P<0.05.
