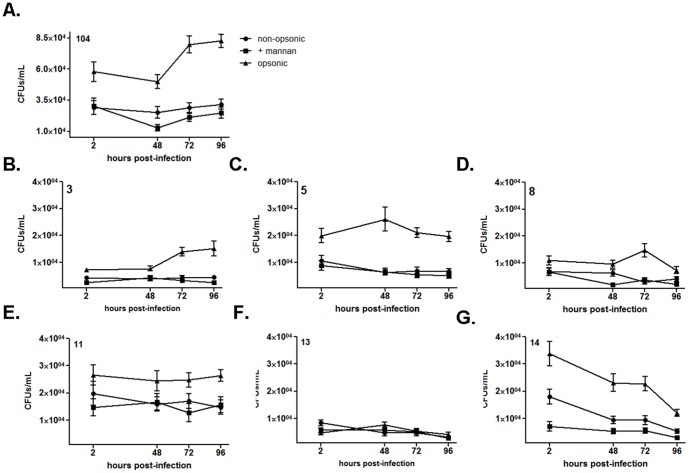
Figure 7. Growth of M. avium spp. isolates in human macrophages.
Macrophage monolayers (2.0×10⁵ cells/well) plated in triplicate in cell culture plate wells were incubated with isolates (MOI 5∶1) for 2 h at 37°C, 5% CO2. Survival curves (CFUs) for MAC reference isolate 104 Ser. 1 (A), isolate 3 Ser. 9 (B), isolate 5 Ser. 4 (C), isolate 8 Ser. 9 (D), isolate 11 Ser. 8 (E), isolate 13 Ser. 4 (F) and isolate 14 Ser. 8 (G) are shown. Infection conditions used were: non-opsonic (round symbol); non-opsonic in the presence of mannan (2.5 mg/ml) (square symbol); and opsonic condition in the presence of 10% fresh autologous non-immune serum (triangle symbol). Note that the vertical axis in panel A differs from the other panels. Shown are cumulative data from N = 3 (mean ± SEM).

