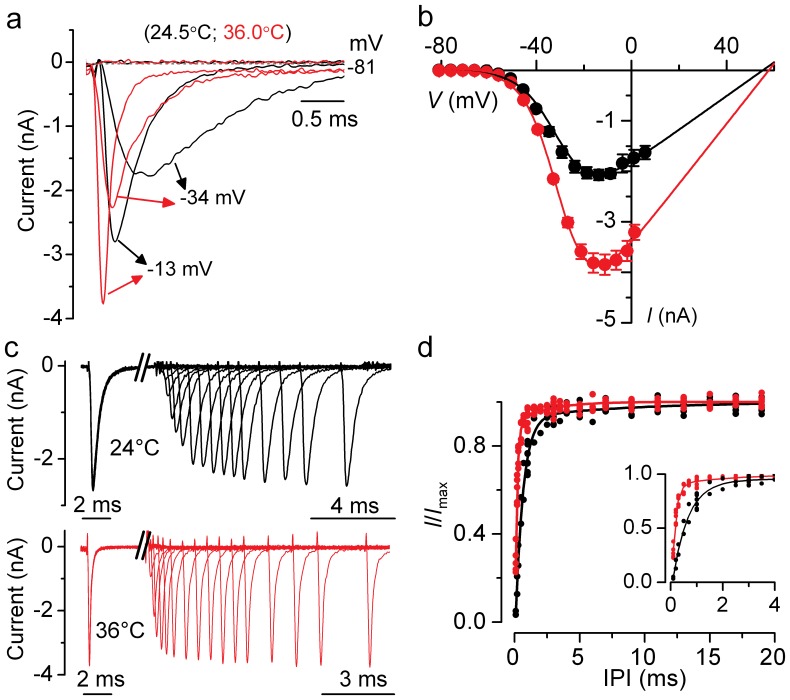
Figure 3. Na+ currents at body and room temperature.
a, Isolated I Na recorded from apical IHCs at body (red traces) and room (black traces) temperature. Currents were elicited by depolarizing voltage steps of 5 mV increments (10 ms in duration) following a 80 ms conditioning step to −110 mV in order to remove I Na inactivation (holding potential was −81 mV). For clarity the first 3 ms of some of the traces are shown. IHC at 36.0°C: C m 10.2 pF, R s 0.84 MΩ, g leak 2.2 nS. IHC at 24.5°C: C m 8.6 pF, R s 1.14 MΩ, g leak 1.28 nS. b, Average peak current-voltage (I–V) curves for the isolated I Na obtained from 5 IHCs at room temperature (black) and 7 IHCs at body temperature (red), including those shown in a. The continuous lines are fits using eqn. 1 and the fitting parameters are: body temperature g max = 60 nS, V rev = 58 mV, V ½ = −30 mV, S = 7.0 mV; room temperature g max = 33 nS, V rev = 55 mV, V ½ = −30 mV, S = 7.6 mV. c and d, Recovery of I Na inactivation recorded at body and room temperature. Na+ currents (c) were elicited in response to 10 ms depolarizing voltage steps to −21 mV from −131 mV with varying the interpulse interval between steps (IPI in ms: 0.1, 0.2, 0.3, 0.5, 0.7, 1, 1.5, 2, 2.5, 3, 3.5, 4, 5, 6, 7, 9, 11, 13, 15, 17, 19). For clarity not all traces are shown. IHCs as in a. The two time scales below the traces refer to the time before and after the axis brake. d, Double exponential fit to individual I/I max values showing the recovery of I Na from inactivation from 9 cells recorded at room temperature (black) and 8 cells at body temperature (red). Expanded time scale for the first 4 ms is shown in the inset.

