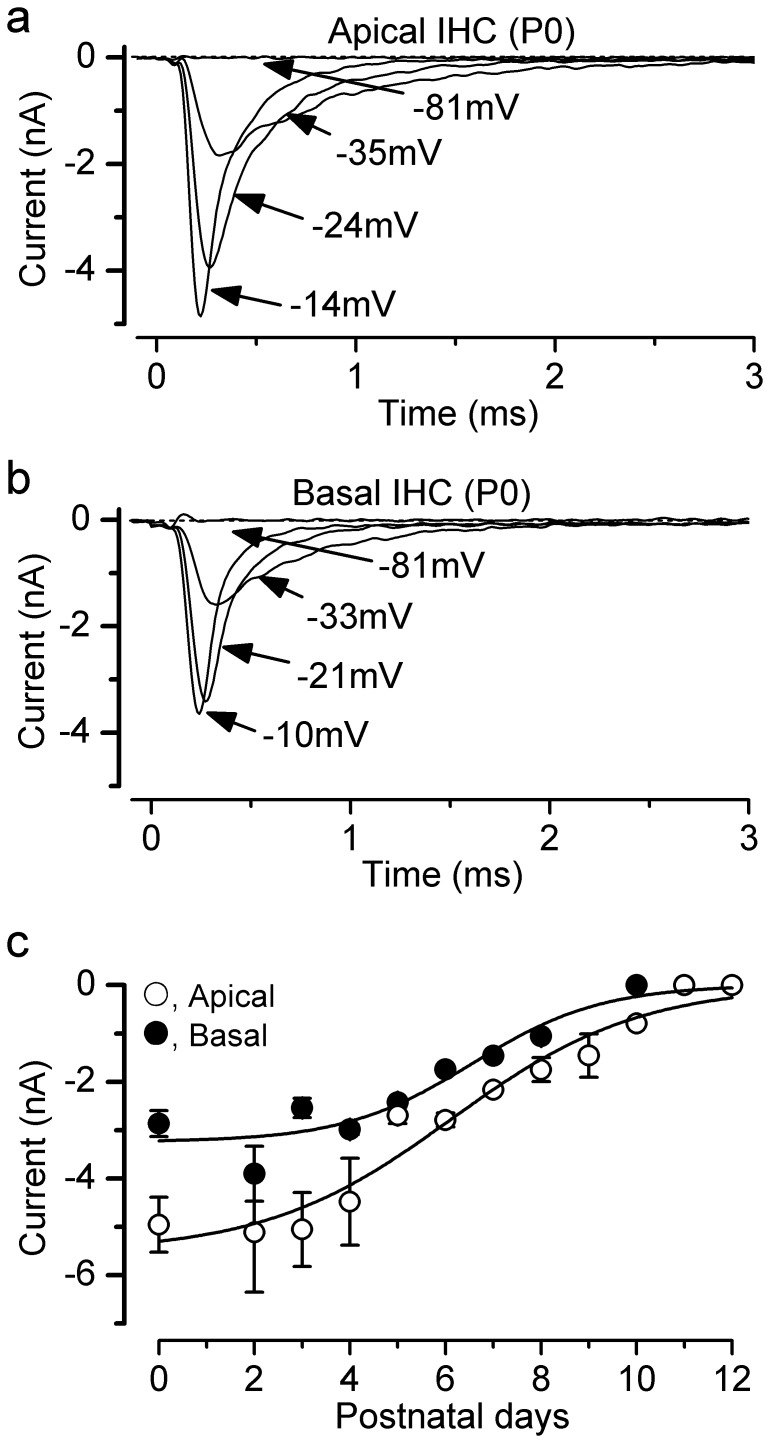
Figure 4. Changes in the size of the Na+ currents during IHC maturation at 36°C.
a,b, Na+ current recorded from apical (a) and basal (b) P0 IHCs with the same voltage protocol described in Fig. 3a. For clarity only some of the traces are shown. Apical IHC: C m 4.5 pF, R s 1.2 MΩ, g leak 0.6 nS. Basal IHC: C m 7.1 pF, R s 1.1 MΩ, g leak 2. 6 nS. c, Development of the peak I Na in apical- and basal-coil IHCs. Fits to the data are according to eqn. 2. Values for t ½ and k are: apical: P6.1, 0.5 d−1; apical: P6.6, 0.7 d−1. Numbers of cells at the various ages (P0–P12) are: Apical 3, 0, 5, 6, 3, 3, 6, 1, 4, 3, 1, 5, 4; Basal 4, 0, 5, 5, 3, 2, 1, 1, 4, 0, 3, 3, 2.

