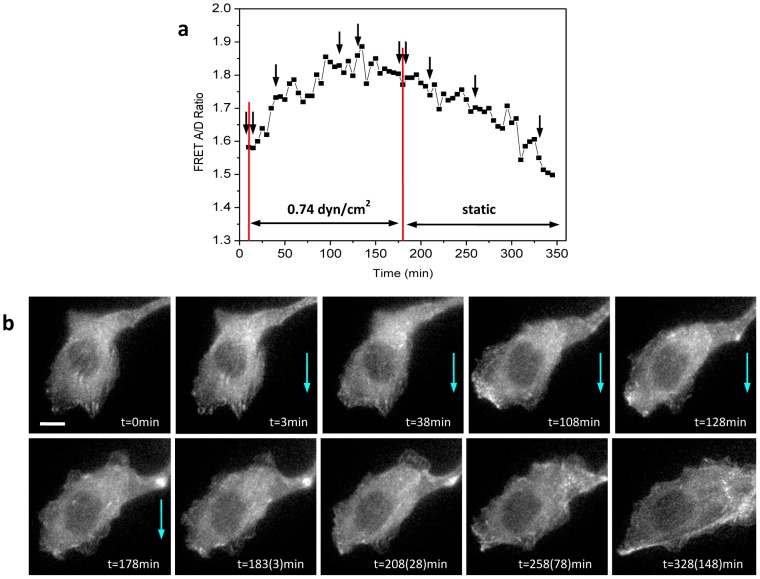
Figure 3. Reversible cytoskeleton reorganization under fluid shear stress.
a: Changes of average FRET ratio in a cell subjected to shear stress of 0.74 dyn/cm2 for 3 hrs and subsequently in stop-flow condition, showing actinin softening in flow and hardening in the no-flow condition. The changes in flow are indicated by red lines. b: Fluorescence images (CFP channel) at times indicated in (a), showing a reversible F-actin reorganization. The scale bar represents 10 µm.

