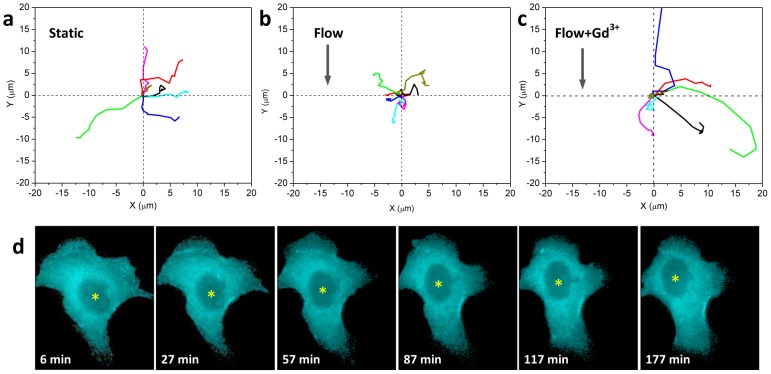
Figure 6. Effect of shear stress on cell motility.
a–c: Trace of single cell movement tracked by centroid of the nucleus for 2.5 hrs under a: static condition; b: shear stress of 0.74 dyn/cm2; and c: same flow condition with addition of 100 µM Gd3+. The cell's original location (defined by the center of nucleus) is at (0,0) and the motion is tracked along the x and y axis every 16 min for a total ∼160 min. The arrows in b and c indicate flow directions. d: CFP images showing the typical movement of a cell under static condition. The yellow stars in (d) indicate the center position of nucleus that was traced and plotted in (a). The scale bar represents 10 µm.

