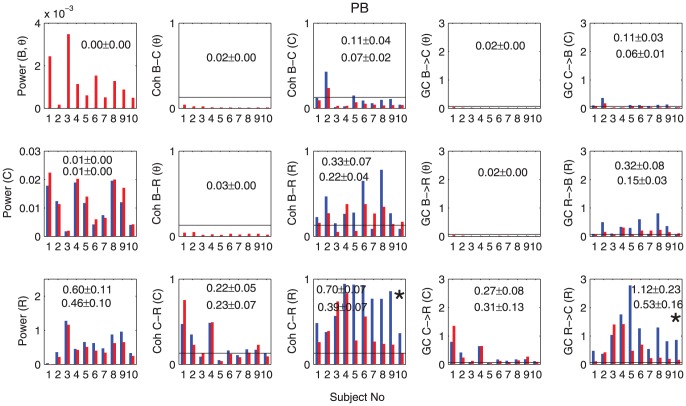
Figure 6. Power, coherence and GC for the PB group.
The summary histograms of average power, coherence and GC before and after transition time for 10 rats the PB group are shown here. The same description of histograms as one for the KX group. Please note that that we do not have the time averages before transition (deep stage) in Power (B) since the  -oscillations are present only in the shallow stage.

