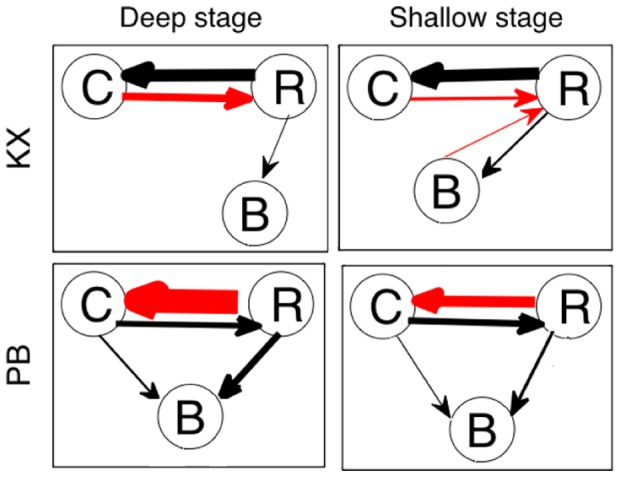
Figure 8. Summary of causal influences in the deep and light stages of anesthesia for both groups.

An arrow is marked if at least one subject has significant time-averaged GC above threshold. The width of arrows is proportional to the magnitude of average of time-averaged GC through all the rats, which are written in Figure 5 and 6. Arrows in red color means that the magnitude of GC changes significantly between the two different stages of anesthesia.
