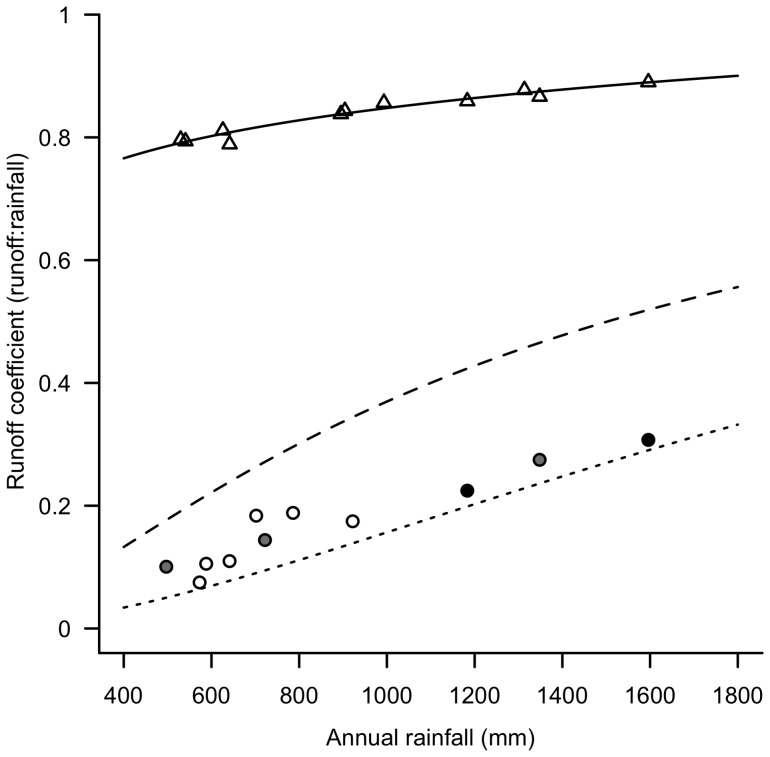
Figure 2. Impervious runoff and streamflow coefficients for the Melbourne region.
Estimated annual runoff coefficients (C) from impervious surfaces (open triangles) from sites across the Melbourne region as a function of mean annual rainfall (MAR). Regression line: C = 0.230+0.206×log10(MAR). R 2 = 0.94. Annual streamflow coefficients from 11 streams with forested (closed circles), grassland (open circles) or mixed forested and grassland catchments (grey circles) across the Melbourne region as a function of mean annual rainfall. The lines surrounding these stream points are the relationships between streamflow derived by Zhang et al. [20] for grassland (dashed curve) and forested catchments (dotted curve) of the world.

