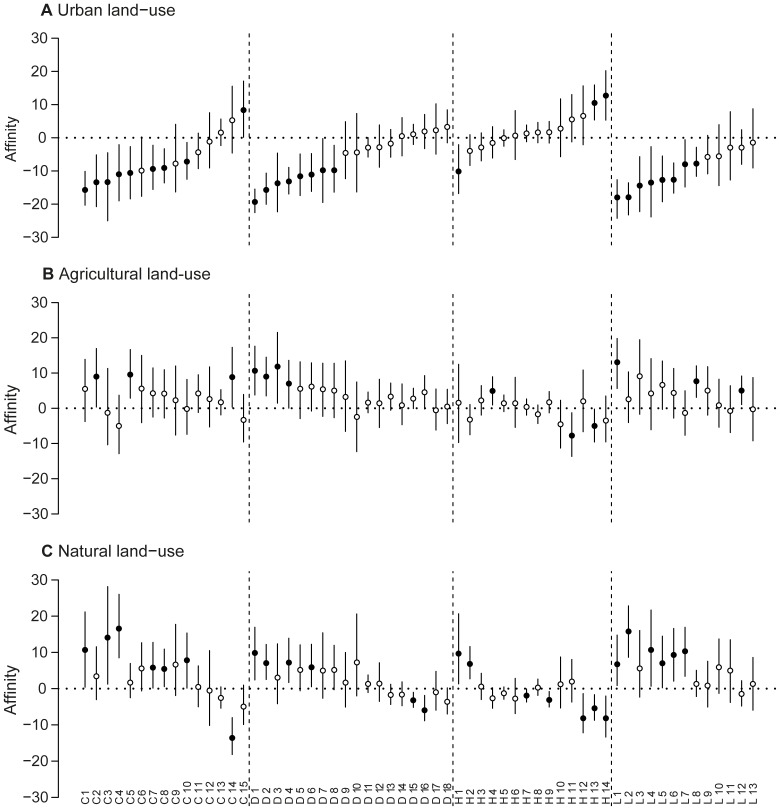
Figure 3. Affinities of the 60 frequent taxa with the three land-use types.
Affinities of the 60 frequent taxa with (A) urban, (B) agricultural and (C) natural land-use. Letters and numbers at the bottom are taxa' identity: C 1–15, D 1–18, H 1–14 and L 1–13 are Coleopterans, Dipterans, Hymenopterans and Lepidopterans, respectively (Table S1). Taxa are sorted by order and increasing affinity with urban land-use. Bars are 95% BCa confidence intervals. Black dots are the specialist and avoider taxa (affinity significantly different from zero) and white dots are tolerant taxa (affinity not significantly different from zero).

