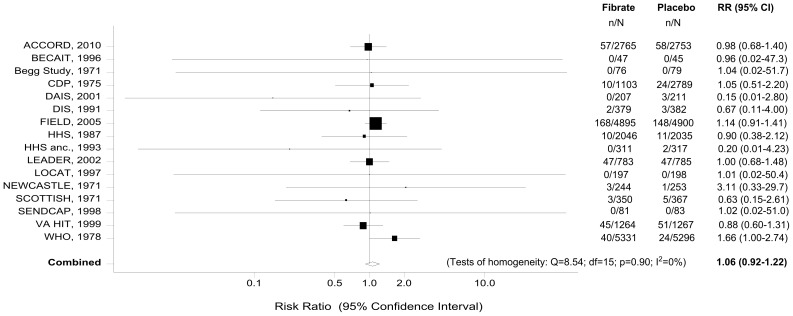
Figure 2. Forest plot of the meta-analysis of fibrate use and cancer deaths.
Footnote: The risk ratios and their 95% confidence intervals are displayed on a logarithmic scale. The size of the data markers represents the relative weight of the trial according to size and occurrence of the outcome being measured.

