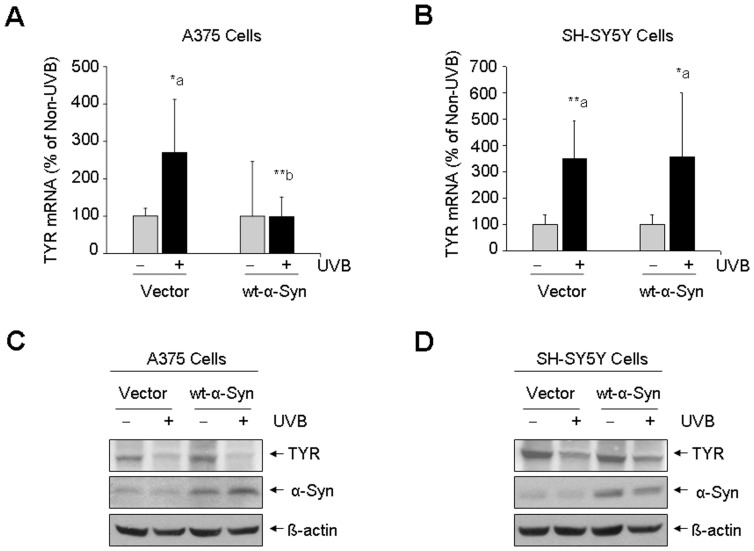
Figure 5. UVB light-induced changes in gene expression and protein level of TYR.
A375 (A) and SH-SY5Y cells (B) with or without α-Syn expression were exposed to UVB light (120 mJ/cm2) or non-UVB light and post-cultured for 24 h. Gene expression of TYR was determined by real-time quantitative PCR assay (A, B). *: p<0.05; **: p<0.01 as compared to its non-UVB control (a) or non-α-Syn control (b). The protein levels of TYR were determined by western blot assay (C, D).

