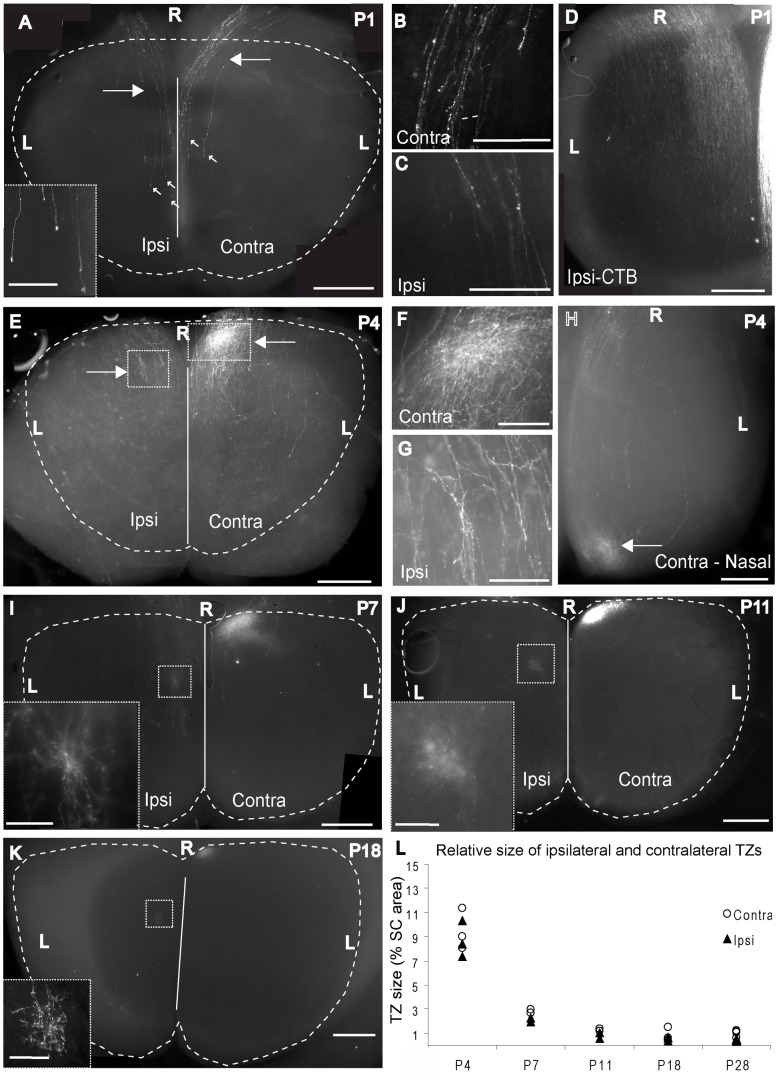
Figure 2. The ipsilateral TZ forms in the visuotopically appropriate region from early stages of development.
A–D: The retinocollicular projection at P1 visualised in whole-mount preparations following injections of DiI (A–C) and CTB (D). Focal injection of DiI into the VTC at P0 reveals retinal axons coursing throughout much of the RC extent of the ipsilateral (ipsi) and contralateral (contra) SC (A). Axons are largely unbranched, including within the prospective TZ regions for both ipsilateral and contralateral axons. These regions are highlighted with arrows and are shown at higher power in B (contra) and C (ipsi). Axons continue caudally past this region and are tipped with growth cones (small arrows highlight growth cones, ipsilateral growth cones are shown at higher power in the Inset in A). Ipsilateral and contralateral axons show a bias towards medial SC. The overall distribution of ipsilateral axons labelled with CTB is visible in D. Axons predominantly target medial SC. E–H: The retinocollicular projection at P4 visualised in whole-mount preparations following injections of DiI into the VTC (E–G) or contralateral nasal (Contra - Nas) retina (H). A TZ, characterised by an increase in the density of label is beginning to emerge in contralateral SC (boxed area in E, right side, shown at higher power in F). The ipsilateral TZ (boxed area in E, left side) is less obvious but an area of increased labelling density is apparent; this is shown at higher power in G. The labelling pattern produced by an equivalent injection into nasal retina is shown for comparison in H, characterised by a clear TZ in contralateral caudal SC. No ipsilateral label was associated with this injection (not shown). I: Wholemount of SC at P7 following an injection of DiI into the VTC. The contralateral TZ is denser and better circumscribed than at P4, although some axons continue caudally past the TZ. The ipsilateral TZ (boxed area) appears diffuse in this preparation, indicating it is located deep to the surface. It can be seen more clearly in the inset which is taken from a horizontal section through the ipsilateral TZ. While it is more clearly defined than at P4, a number of axons continue caudally for some distance. The black box in the bottom right of the image corresponds to a small, unlabelled region of the SC that was inadvertently missed during the photomontage process. J: Horizontal section through the SC at P11 following a DiI injection into VTC. The contralateral and ipsilateral (boxed area, shown at higher power in the inset) TZs are now well circumscribed. K: As for J, but from a P18 mouse. Projections show little change from P11. L: Graph plotting the size of the ipsilateral and contralateral TZs relative to SC area across development. Symbols represent individual cases. The size of both decreases significantly between P4 and P7 (p<0.001, see results) and further between P7 and P11 (p<0.05, see results). No significant change is observed subsequent to P11 (p>0.9). Scale bars: A, D, E, H, I, J, K: 500 µm; B, C, F, G: 250 µm; insets in A, I, J, K: 100 µm. R: Rostral; L: Lateral. Dashed lines delineate the borders of the SC. Solid lines mark the midline.

