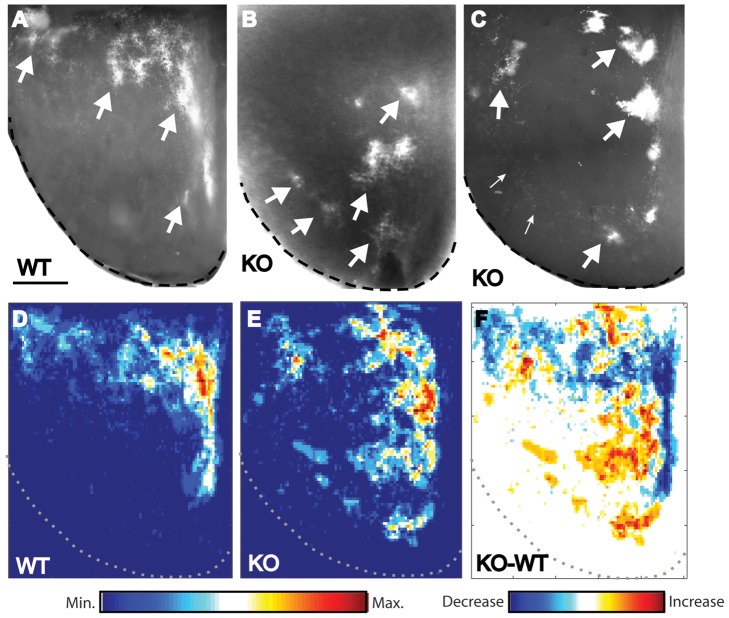
Figure 5. Ten-m3 is required for targeting of ipsilateral axons to rostromedial SC.
A–C: Horizontal sections through the SC following injection of CTB into the ipsilateral eye from WT (A) and Ten-m3 KO (B, C) mice. Rostral is to the top and medial to the right in all images. In WTs, ipsilateral terminals form clusters that are confined almost entirely to rostromedial portions of the SC (A). Ipsilateral terminals are clustered but are much more widely distributed in Ten-m3 KO mice. In B, terminals largely avoid rostral SC and are seen in mid and even in caudolateral SC. A less extreme case is shown in C. Here, ipsilateral terminals do target rostral SC, but are also seen in more caudal and lateral areas that do not receive ipsilateral innervation in WTs. Some larger clusters of terminals are highlighted by large arrows. Small arrows point to smaller clusters of ipsilateral terminals that were seen in caudolateral SC in some KO cases. D–F: Heat-maps indicating overall distribution of ipsilateral label in WT and Ten-m3 KOs compiled across all cases. Rostral is to the top and medial to the right in all images, with dashed lines delineating the borders of the SC. The distribution in WTs is highly stereotyped with label concentrated in rostromedial areas (D). In Ten-m3 KOs ipsilateral terminals are much more widely distributed (E), with clusters seen in more caudal and lateral regions compared to WTs. A subtraction of the WT and KO heat-maps is shown in F to give a clear view of the location and direction of change. Colour bar (D, E): Relative intensity of labelling; Colour bar (F): Difference in intensity between WT and KOs; Scale in A: 500 µm, applies to A–F.

