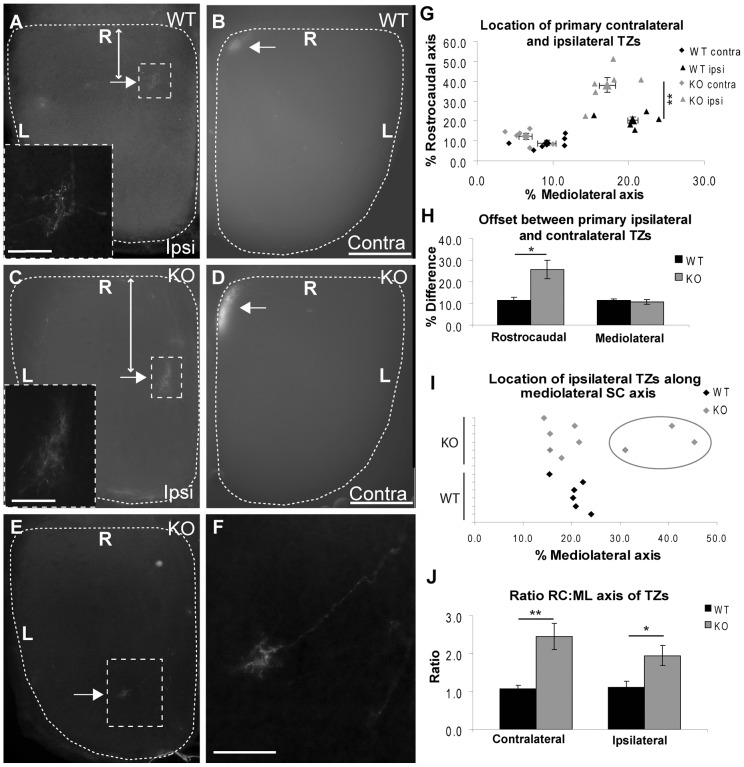
Figure 6. Deletion of Ten-m3 results in mapping changes along the RC and ML axes of the SC.
A–B: Horizontal section through the ipsilateral SC (A) and whole-mount preparation of the contralateral SC (B) following an injection of DiI into the VTC from a P11 WT mouse. The contralateral TZ forms a densely labelled region near the rostromedial corner of the SC (B, arrow). The ipsilateral TZ (arrow, boxed region also shown at higher power in inset; A) arising from the same injection is offset caudally and laterally, and is located at around 20% of the distance along each collicular axis. The distance of the centre of the ipsilateral TZ from the rostral border of the SC is marked by a double-headed arrow. Borders of the SC are indicated by dashed lines. C–D: As for A–B but from a Ten-m3 KO mouse. The contralateral TZ occupies a similar location to that in WT at the rostromedial corner of the SC (D, arrow). The primary ipsilateral TZ occupies a similar location to WT along the ML axis (around 18%), but is shifted much further caudally along the RC axis (41%; C, arrow). Note the increase in the length of the double-headed arrow in the KO (C) which marks the distance of the ipsilateral TZ from the rostral border of the SC compared to the WT example (A). E–F: Adjacent (deeper) section to that shown in C, revealing the location of a secondary ipsilateral TZ (boxed region, shown at higher power in F). The secondary TZ is displaced both caudally (at 75% of the RC axis) and mediolaterally (at 40% of the SC axis) from the primary TZ. An additional labelled axon can also be seen (F) but did not form a clear TZ. G: Scatter plot showing the location of the centre of the primary contralateral and ipsilateral TZs in 6 WT and 6 Ten-m3 KO mice. Means ± standard errors (s.e.) are also plotted. Contralateral TZs were centred at around 10% of each axis in WT whereas ipsilateral TZs are located significantly further caudally and laterally compared to contralateral TZs, at around 20% of each axis (p<0.05, Student's t-test, see results). The distribution of contralateral TZs in Ten-m3 KO overlaps with that of WT for both axes (p>0.05, Multivariate ANOVA, see results). The location of the primary ipsilateral TZ in Ten-m3 KOs overlaps with that of the WT ipsilateral TZs along the ML axis (p>0.05. Multi-variate ANOVA, see results). The location of the primary ipsilateral TZs are, however, significantly further caudal than in WTs, at around 40% of the RC axis (p<0.01, Multivariate ANOVA, see results). H: Graph plotting the offset of the primary ipsilateral and contralateral TZs in WTs and Ten-m3 KOs. Their separation along the ML axis of the SC is identical between KOs and WTs (p>0.6, Student's t-test, see results), but is significantly increased along the RC axis in KOs (p<0.05, Student's t-test, see results). I: Plot showing the distribution of both primary and secondary ipsilateral TZs along the ML axis of the SC. The presence of a laterally-shifted, secondary TZ in 3 out of 6 KOs is highlighted by the grey ring. Laterally-shifted, secondary TZs are not observed in any WTs. J: Graph illustrating a significant increase in the ratio of RC to ML (RC:ML) axes of TZs in the SC for both contralateral and ipsilateral retinocollicular projections in Ten-m3 KOs (Contra: p<0.01; Ipsi: p<0.05, Multivariate ANOVA, see results for details). Scale bars: B, D: 500 µm; Bar in B also applies to A. Inset in A: 150 µm. Inset in C: 100 µm. Bar in D applies to C and E. Bar in F: 200 µm. Rostral is to the top in all images. R: Rostral; L: Lateral. * p<0.05; ** p<0.01.

