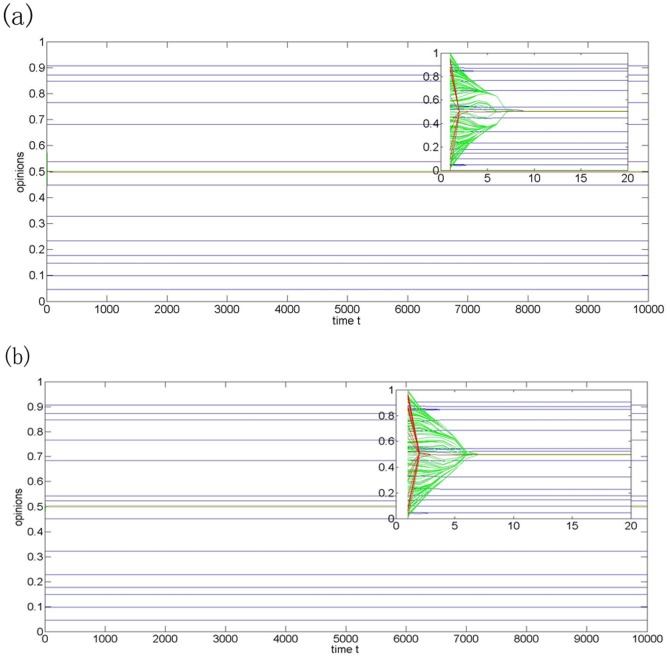
Figure 5. Opinion evolution of model (2) with N = 200,  = 0.01(blue-for close-minded agents),
  = 0.2(green-for moderate-minded agents),
  = 0.45(red-for open-minded agents).
(a)The fractions of agents in three groups are, respectively, 10%, 50%, and 40%; (b) The fractions of agents in three groups are, respectively, 10%, 20%, and 70%.

