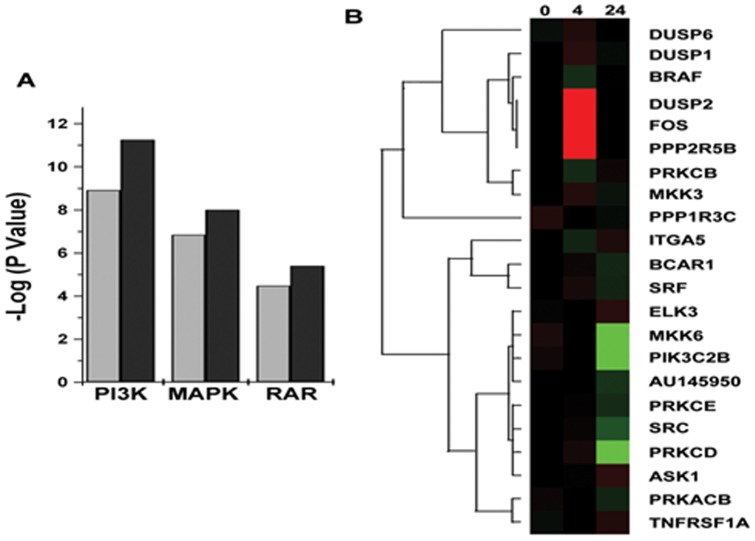
Figure 3. Regulation of Gene expression associated with Molecular functions, Biological Processes or Cellular component.
Gene expression was analyzed with respect to gene ontology Groups and the number of genes that showed more than fivefold changes within each ontology group were identified. A)Genes that show an average change more than 5 fold up-regulation compared to control (p value<0.05) upon oxalate exposure grouped based on gene ontology using GenMAPP ; B) Genes that show an average change more than 5 fold down-regulation compared to control (p value<0.05) upon oxalate exposure grouped based on gene ontology using GenMAPP.

