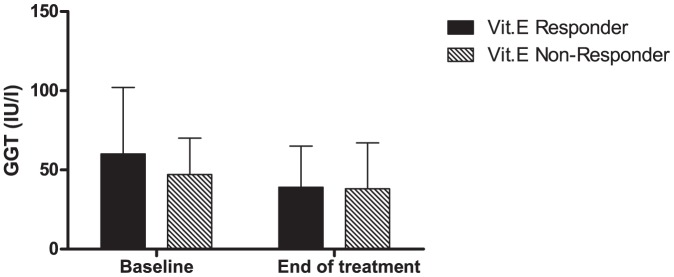
Figure 2. Baseline and end of treatment levels of gamma glutamyl transpeptidase in vitamin E responders and non-responders are shown.
The baseline values in both groups are comparable. At the end of treatment, the levels decreased in both groups but the degree of decrease was greater in vitamin E responders. This however was only a trend and not statistically significant.

