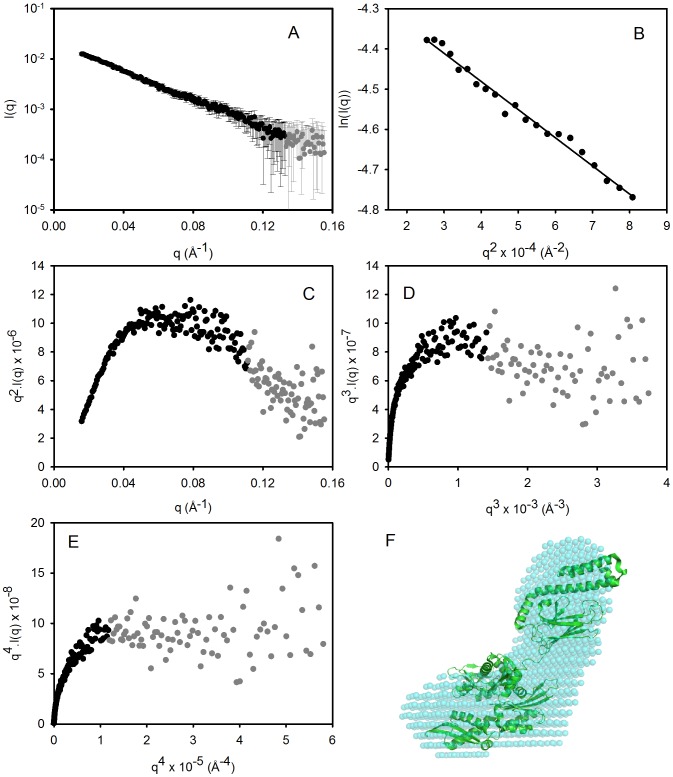
Figure 2. SAXS analysis of GRP78.
(A) The raw SAXS data are shown as circles representing mean intensity I(q) as a function of momentum transfer q. Error bars indicate ±1 standard deviation (σ). Black symbols: I(q) ≥ σ and grey symbols: I(q) < σ. (B) Guinier plot for these SAXS data for q.Rg<1.3. (C) Kratky plot of the SAXS data. (D & E) Porod-Debye plots as a function of q 3 and q 4, respectively. (F) The SAXS-derived ab initio shape reconstruction (average filtered shape from 10 reconstructions) is shown superimposed on the NMR-refined domain arrangement of the crystallographic structures of the N-and C-terminal domains of the bacterial GRP78 homologue DnaK [26].

