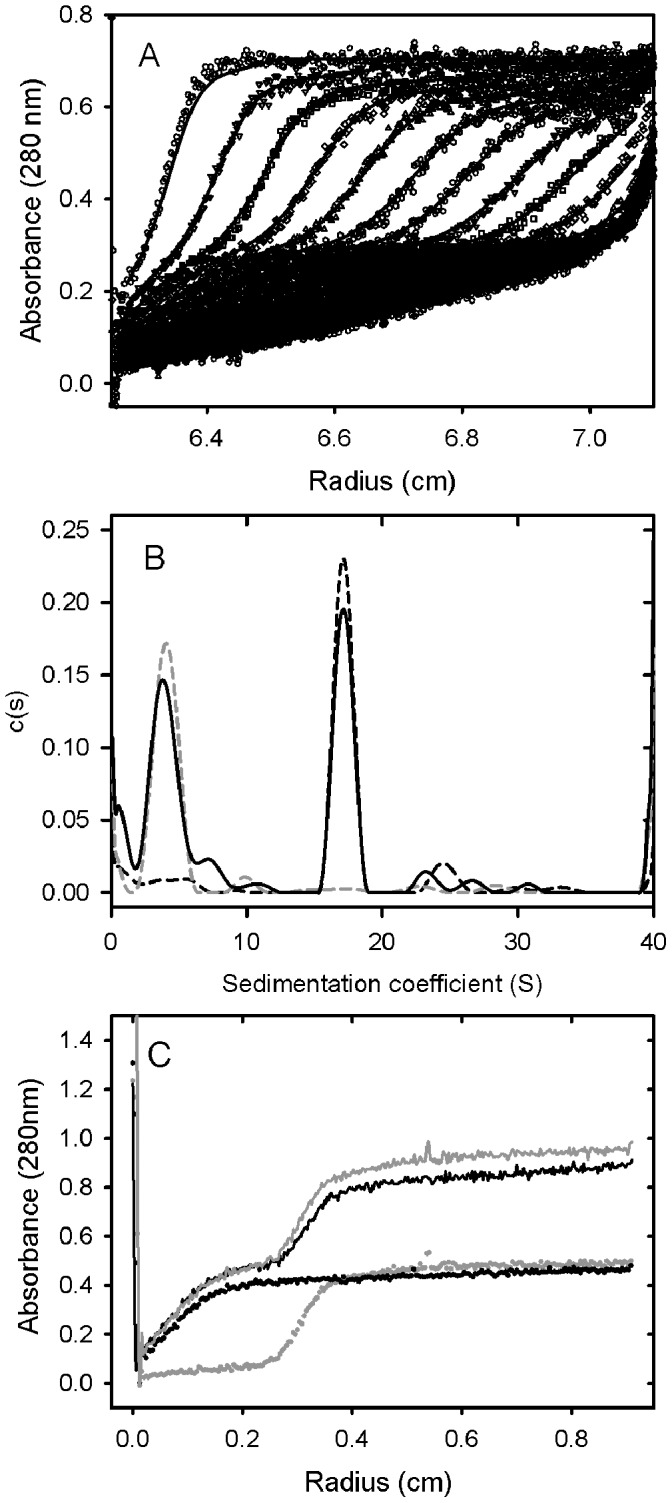
Figure 5. Sedimentation velocity analysis of a mixture of PAT-SM6 and GRP78.

A. 0.4 mg/mL of PAT-SM6 and 0.4 mg/mL of GRP78 were incubated together and centrifuged at 28,000 rpm. The resulting sedimenting absorbance boundaries were monitored at 280 nm and representative data shown as open circles. Fits to the experimental data using a c(S) sedimentation model are shown as solid lines. B. Corresponding c(S) size distribution plots for the data presented in (A) for PAT-SM6 (black dashed line), GRP78 (grey dashed line) and the mixture of the two proteins (solid line). C. Radial distributions obtained after centrifugation at 28,000 rpm for 72 min for PAT-SM6 (0.4 µM; grey circles), GRP78 (10 µM; black circles) and mixture of PAT-SM6 (0.4 µM) and GRP78 (10 µM, solid line). The solid grey line is the sum of the radial distributions obtained for PAT-SM6 and GRP78 alone, assuming no interaction.
