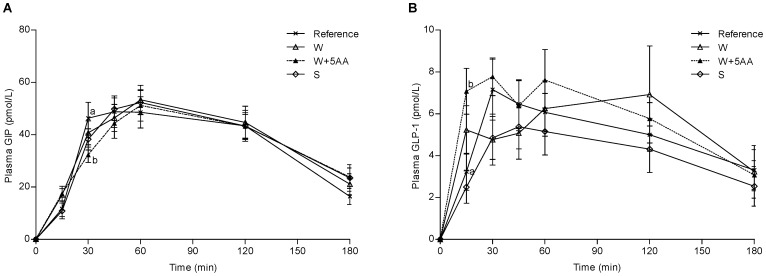
Figure 3. Postprandial plasma incretin responses.
Mean (± SEM) incremental postprandial changes in GIP (A) and GLP-1 (B) in response to equal amounts of carbohydrates from a reference meal and the PMPD meals; n = 14 (n = 13 for S and S+6AA; n = 12 for W+6AA). Significant treatment effects (P<0.0001) but no time x treatment interactions were found for neither GLP-1 nor GIP. S (soy protein isolate); W (whey protein isolate); W+5AA (W, iso, leu, lys, thr and val).

