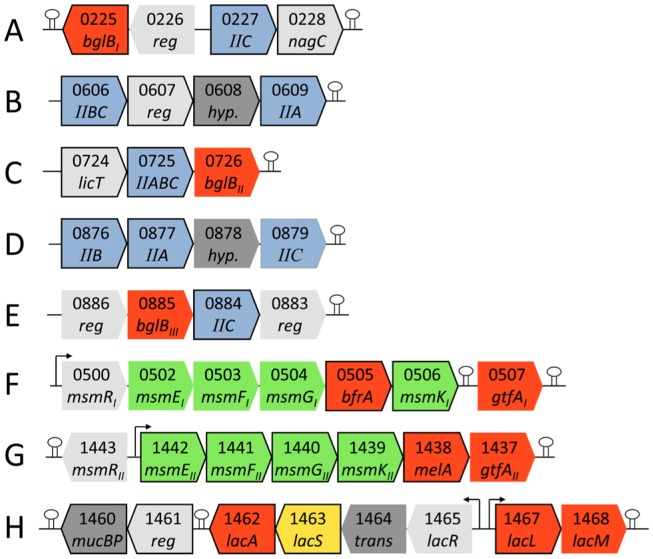
Figure 3. Organization of gene clusters encoding upregulated genes by potential prebiotic oligosaccharide stimulation.
All genes are listed with locus tag number and gene name (PTS permeases are shown with domain name; regulators, hypothetical proteins and transposons are abbreviated as reg, hyp. and trans respectively). Gene product functions are colored red for glycoside hydrolases, light grey for transcriptional regulators, blue for PTS permease domains, dark grey for proteins unrelated to carbohydrate metabolism, green for ABC transporter domains and yellow for the GPH permease. All upregulated genes (Table 2) are shown with framed boxes, CRE regulatory sites are represented by arrows and predicted rho-independent transcription terminators [49] by stem loops.

