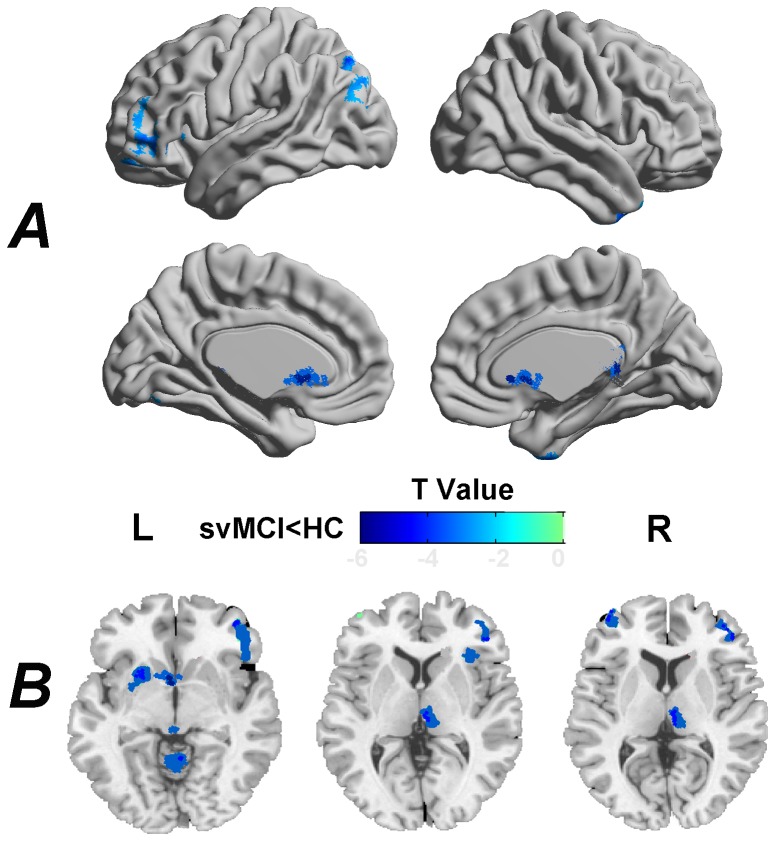
Figure 1. Cortical (A) and subcortical (B) GM volume loss in svMCI.
The svMCI patients showed decreased GM volume in several frontal, temporal, occipital and subcortical brain regions. For the details, see Table 2. The statistical threshold was set at P<0.01 for individual voxels and cluster size >948 mm3, which corresponded to a corrected P<0.01 determined by Monte Carlo simulations. Cortical (A) t statistical maps were rendered by using the BrainNet Viewer (http://www.nitrc.org/projects/bnv/). Subcortical (B) t statistical map was overlaid on a single anatomical image (i.e., ch2bet.nii) provided in the MRIcroN software (http://www.cabiatl.com/mricro/). R, right; L, left.

