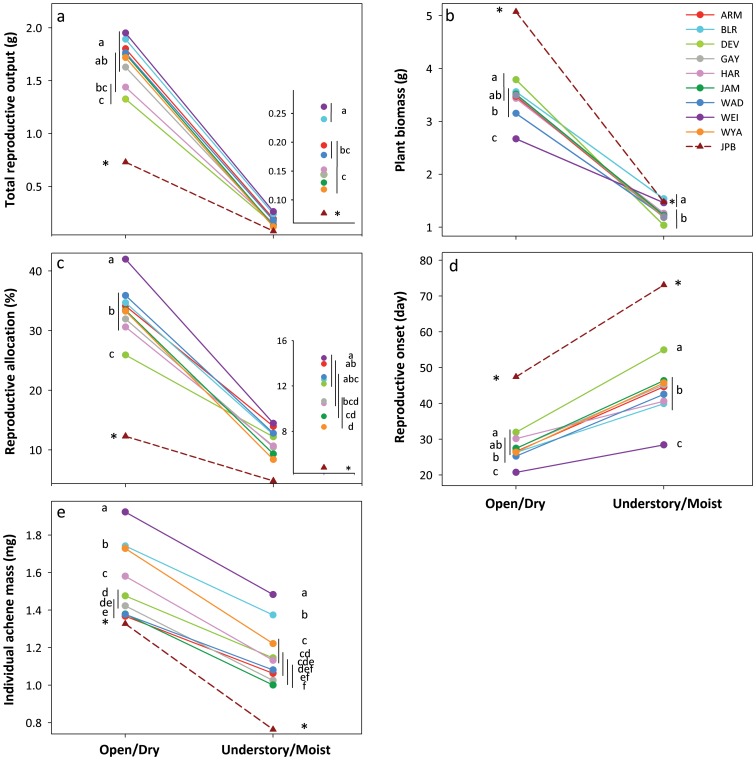
Figure 3. Population differences in plastic responses of morphological, allocational and physiological traits to contrasting habitat treatments.
a) Specific leaf area, b) Root: Leaf Biomass ratio, c) Photosynthetic rate, d) Stomatal conductance and e) Water use efficiency. Population means ± se are shown for 13–19 genotypes per population. Inset in a), shows details of results in the Open/Dry treatment. Different letters and non-overlapping vertical lines show significant differences among populations in each habitat at the 0.05 level (SNK post-hoc test). An asterisk indicates a significant difference between the native population (JPB) and the introduced-range populations (linear contrast). NS indicates no significant population differences. Axes are scaled to 5–95% of data range.

